• Photonics Research
  • Vol. 10, Issue 9, 2115 (2022)
Xuan Mao1、†, Hong Yang1、†, Dan Long1, Min Wang2、6、*, Peng-Yu Wen1, Yun-Qi Hu1, Bo-Yang Wang1, Gui-Qin Li1、3, Jian-Cun Gao1、3, and Gui-Lu Long1、2、3、4、5、7、*
Author Affiliations
  • 1Department of Physics, State Key Laboratory of Low-Dimensional Quantum Physics, Tsinghua University, Beijing 100084, China
  • 2Beijing Academy of Quantum Information Sciences, Beijing 100193, China
  • 3Frontier Science Center for Quantum Information, Beijing 100084, China
  • 4Beijing National Research Center for Information Science and Technology, Beijing 100084, China
  • 5School of Information, Tsinghua University, Beijing 100084, China
  • 6e-mail: wangmin@baqis.ac.cn
  • 7e-mail: gllong@tsinghua.edu.cn
  • show less
    DOI: 10.1364/PRJ.463775 Cite this Article Set citation alerts
    Xuan Mao, Hong Yang, Dan Long, Min Wang, Peng-Yu Wen, Yun-Qi Hu, Bo-Yang Wang, Gui-Qin Li, Jian-Cun Gao, Gui-Lu Long. Experimental demonstration of mode-matching and Sagnac effect in a millimeter-scale wedged resonator gyroscope[J]. Photonics Research, 2022, 10(9): 2115 Copy Citation Text show less
    Optical circuit of the experiment. VOA, variable optical attenuator; PC, polarization controller; BS, beam splitter; AOM, acoustic optical modulator; PD, photodetector; OSC, oscilloscope; LIA, lock-in amplifier. The inset illustrates the top view of the coupling between the wedged resonator and the fiber taper.
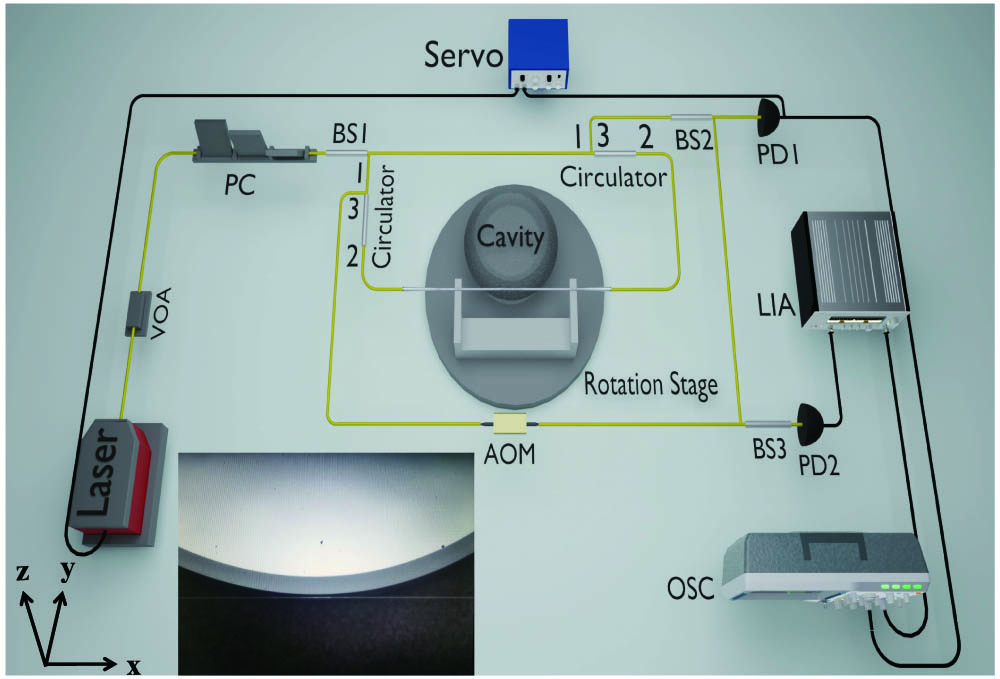
    Fig. 1. Optical circuit of the experiment. VOA, variable optical attenuator; PC, polarization controller; BS, beam splitter; AOM, acoustic optical modulator; PD, photodetector; OSC, oscilloscope; LIA, lock-in amplifier. The inset illustrates the top view of the coupling between the wedged resonator and the fiber taper.
    Characterization of the fiber taper. (a)–(d) are the side view scanning electron microscope images of the fiber taper. (e) illustrates the diameters of the fiber taper versus relative distances to the marked point in the experiment along the x axis shown in Fig. 1.
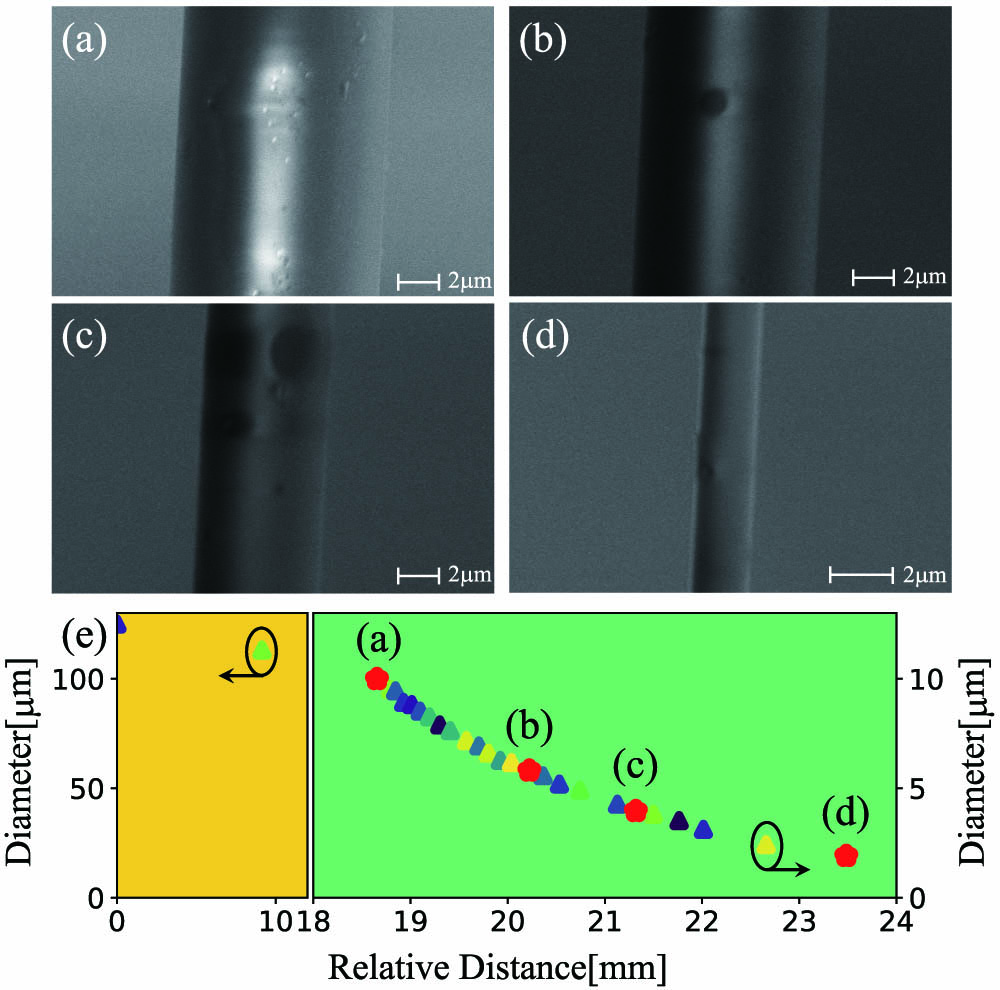
    Fig. 2. Characterization of the fiber taper. (a)–(d) are the side view scanning electron microscope images of the fiber taper. (e) illustrates the diameters of the fiber taper versus relative distances to the marked point in the experiment along the x axis shown in Fig. 1.
    Experimental results. (a) Transmission spectra of the wedged resonator coupled with different positions of the fiber taper characterized by different diameters. The inset illustrates the theoretical prediction κ2/κ02 demonstrated by Eq. (5) versus the difference of propagation constants of the fiber taper and the WGM with m=10, R0=1.25 mm, γt=2.5×10⁻⁷ m−2. (b) The coupling efficiency and Q factor (at 1548.92 nm) versus the diameters of the fiber taper.
    Fig. 3. Experimental results. (a) Transmission spectra of the wedged resonator coupled with different positions of the fiber taper characterized by different diameters. The inset illustrates the theoretical prediction κ2/κ02 demonstrated by Eq. (5) versus the difference of propagation constants of the fiber taper and the WGM with m=10, R0=1.25  mm, γt=2.5×10⁻⁷m2. (b) The coupling efficiency and Q factor (at 1548.92 nm) versus the diameters of the fiber taper.
    Experimental results. (a) Gyroscope readouts versus LIA reference frequency for different rotation directions. (b) Gyroscope readouts versus rotation velocity with fixed LIA reference frequency and the same rotation direction.
    Fig. 4. Experimental results. (a) Gyroscope readouts versus LIA reference frequency for different rotation directions. (b) Gyroscope readouts versus rotation velocity with fixed LIA reference frequency and the same rotation direction.
    Experimental results. Gyroscope readouts when the wedged resonator experiences rest-accelerating-rotate uniformly-decelerating-rest five states for different rotation velocities and different directions. From top to bottom, the rotation modes are 5 deg/s CCW, 7 deg/s CW, and 8 deg/s CCW, respectively.
    Fig. 5. Experimental results. Gyroscope readouts when the wedged resonator experiences rest-accelerating-rotate uniformly-decelerating-rest five states for different rotation velocities and different directions. From top to bottom, the rotation modes are 5 deg/s CCW, 7 deg/s CW, and 8 deg/s CCW, respectively.
    Detected frequency beat versus rotation frequency. CW and CCW rotation directions are marked by triangles and circles, respectively. The solid line denotes the theoretical curve presented by Eq. (8).
    Fig. 6. Detected frequency beat versus rotation frequency. CW and CCW rotation directions are marked by triangles and circles, respectively. The solid line denotes the theoretical curve presented by Eq. (8).
    Xuan Mao, Hong Yang, Dan Long, Min Wang, Peng-Yu Wen, Yun-Qi Hu, Bo-Yang Wang, Gui-Qin Li, Jian-Cun Gao, Gui-Lu Long. Experimental demonstration of mode-matching and Sagnac effect in a millimeter-scale wedged resonator gyroscope[J]. Photonics Research, 2022, 10(9): 2115
    Download Citation