
Di Lu, Xiao Wei, Xin Cao, Xiaowei He, Yuqing Hou. Fast Reconstruction Method for Fluorescence Molecular Tomography Based on Autoencoder[J]. Acta Optica Sinica, 2019, 39(6): 0617001
- Acta Optica Sinica
- Vol. 39, Issue 6, 0617001 (2019)
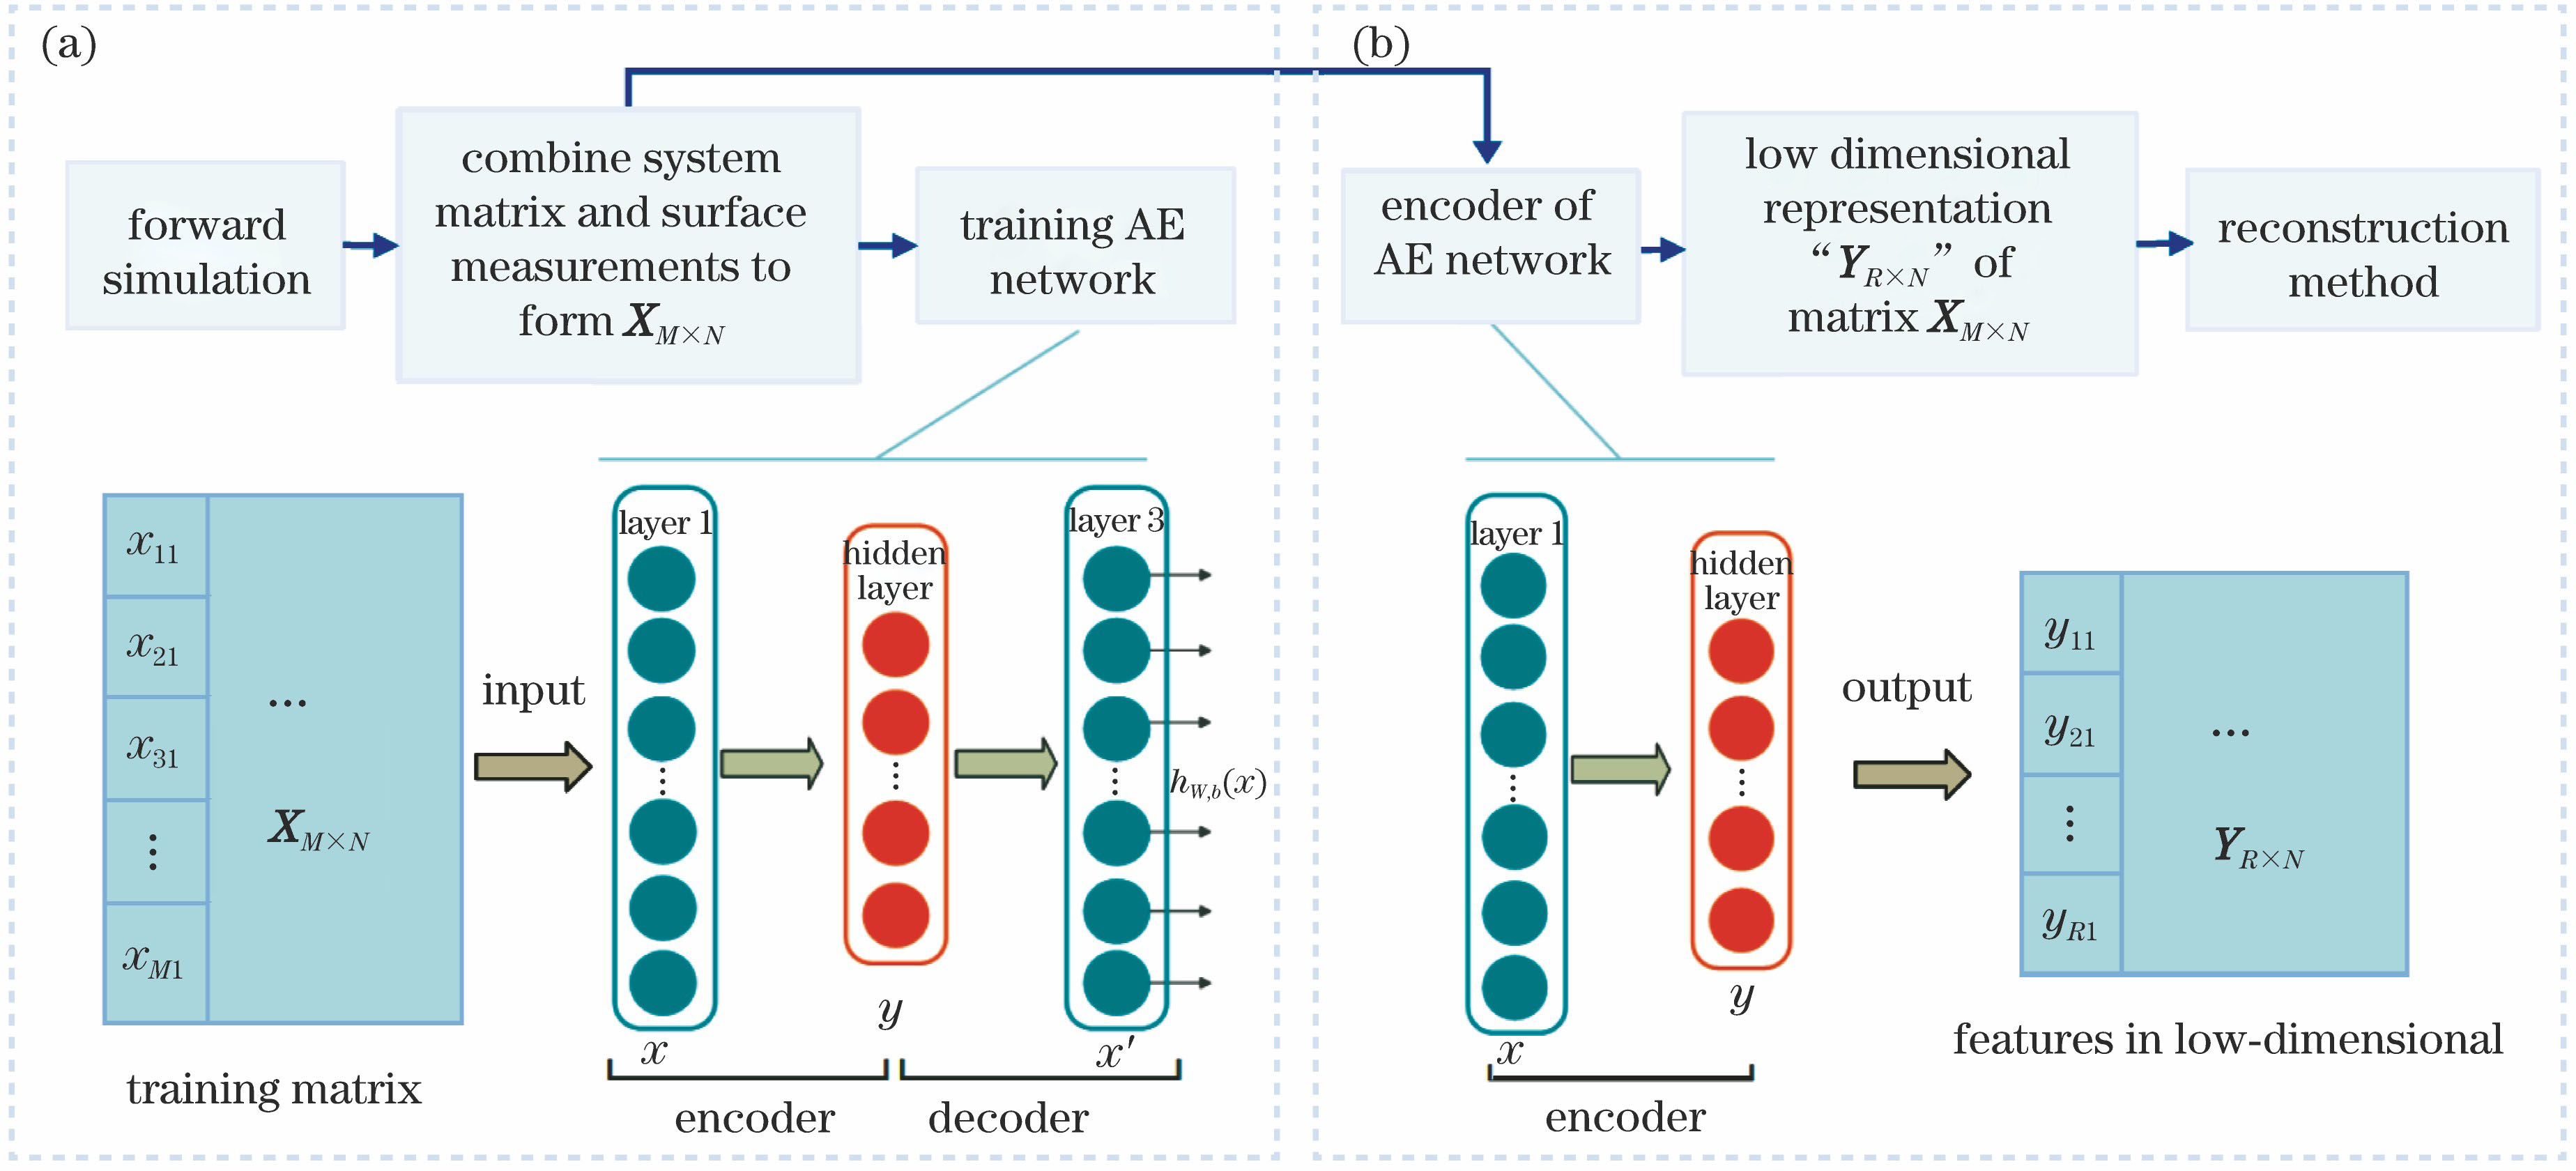
Fig. 1. Framework of FMT rapid reconstruction based on autoencoder
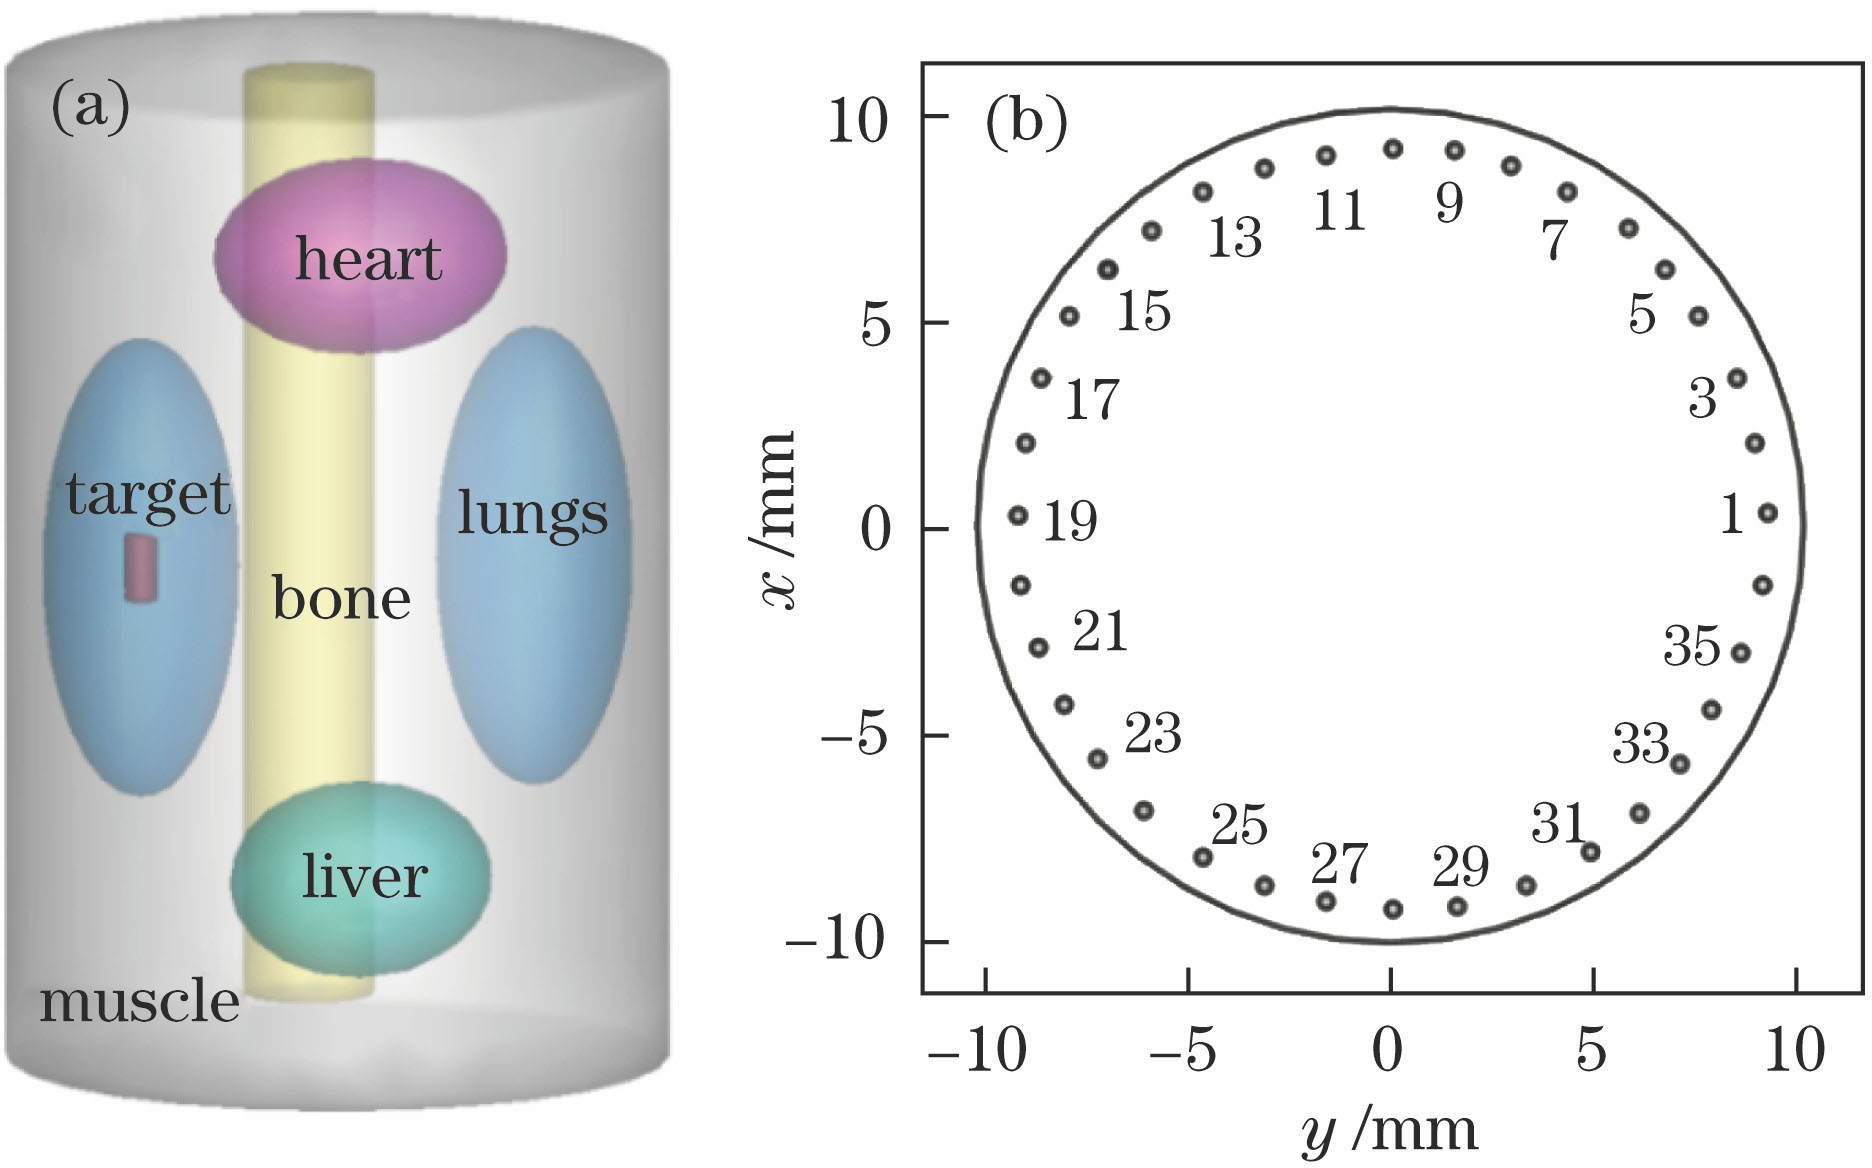
Fig. 2. Diagram of the non-homogeneous cylinder phantom. (a) Model of non-homogeneous cylinder phantom; (b) distribution of shot points at plane of z=15 mm
Fig. 3. Result diagram of single-source reconstruction. (a)-(c) Stereogram of reconstruction results, the 2D cross-section views at planes of x=0 mm and z=15 mm with original data; (d)-(f) stereogram of reconstruction results, the 2D cross-section views at planes of x=0 mm and z=15 mm with AE method
Fig. 4. T1 and T2 reconstruction results using AE method under different dimensionality. (a) Reconstruction results of T1; (b) reconstruction results of T2
Fig. 5. Result diagram of double-sources reconstruction. (a)-(c) Stereogram of reconstruction results, the 2D cross-section views at planes of x=0 mm and z=15 mm with original data; (d)-(f) stereogram of reconstruction results, the 2D cross-section views at planes of x=0 mm and z=15 mm with AE method
Fig. 6. Single source reconstruction results in digital mouse experiments using AE method under different dimensionality
Fig. 7. Results of single source in digital mouse experiments. (a)-(c) Stereogram of reconstruction results, the 2D cross-section views at planes of x=11.9 mm and z=16.4 mm with original data; (d)-(f) stereogram of reconstruction results, the 2D cross-section views at planes of x=11.9 mm and z=16.4 mm with AE method
Fig. 8. Reconstruction results of T1 and T2 when compressed to different dimensions using AE. (a) Reconstruction results of T1; (b) reconstruction results of T2
Fig. 9. Results of double-sources in digital mouse experiments. (a)-(c) Stereogram of reconstruction results, the 2D cross-section views at planes of x=11.9 mm and z=16.4 mm with original data; (d)-(f) stereogram of reconstruction results, the 2D cross-section views at planes of x=11.9 mm and z=16.4 mm with AE method
|
Table 1. Optical parameters for non-homogeneous cylinder phantom
|
Table 2. Reconstruction results of single source non-homogeneous cylinder phantom simulation experiments using AE method
|
Table 3. Quantitative simulation results of single source non-homogeneous cylinder using AE method under different number of excitation sources
|
Table 4. Quantitative simulation results of single source non-homogeneous cylinder using AE method under different noise levels
|
Table 5. Quantitative simulation results of double sources non-homogeneous cylinder phantom simulation experiments using AE method
|
Table 6. Quantitative simulation results of single source in digital mouse experiments using AE method
|
Table 7. Quantitative simulation results of double sources in digital mouse experiments using AE method

Set citation alerts for the article
Please enter your email address
© Copyright 2018-2021 | Chinese Laser Press. All Rights Reserved 沪ICP备15018463号-20