• Photonics Research
  • Vol. 10, Issue 4, 1117 (2022)
Xiangyu Zeng1, Yuqin Zhang1、2, Manna Gu1, Zijun Zhan1, Ruirui Zhang1、3, Yu Zhang1, Rui Sun1, Changwei He1、2, Chunxiang Liu1, and Chuanfu Cheng1、*
Author Affiliations
  • 1School of Physics and Electronics, Shandong Normal University, Jinan 250014, China
  • 2School of Science, Shandong Jianzhu University, Jinan 250101, China
  • 3School of Computer Science and Technology, Shandong University of Finance and Economics, Jinan 250014, China
  • show less
    DOI: 10.1364/PRJ.451637 Cite this Article Set citation alerts
    Xiangyu Zeng, Yuqin Zhang, Manna Gu, Zijun Zhan, Ruirui Zhang, Yu Zhang, Rui Sun, Changwei He, Chunxiang Liu, Chuanfu Cheng. Arbitrary manipulations of focused higher-order Poincaré beams by a Fresnel zone metasurface with alternate binary geometric and propagation phases[J]. Photonics Research, 2022, 10(4): 1117 Copy Citation Text show less
    Schematic for generating the focused HOP beams via an FZ metasurface. (a) Basics for the generation of focused HOP beams. Upon illumination of incident beam of a wavelength λ (λ=632.8 nm, 532 nm, and 473 nm) with the arbitrary polarization state |uin⟩=a1|R⟩+a2|L⟩ described as the superposition of RCP (represented by the light blue arrow) and LCP (represented by the upward wine arrow) components, the output beam is the superposition of the LCP and RCP OAM states of |L,−2m⟩ and |R,2m⟩ with weights a1 and a2, respectively. (a) Panel i, enlarged view of a representative slit. (a) Panel ii, intensity patterns of focused HOP beams generated at the center focal plane. (b) SEM image and (c) enlarged view of the FZ metasurface with geometric parameters m=3/2 and φ0=π/2. (d) Illustrative geometry for the theoretical analysis of the VB produced by the metasurface.
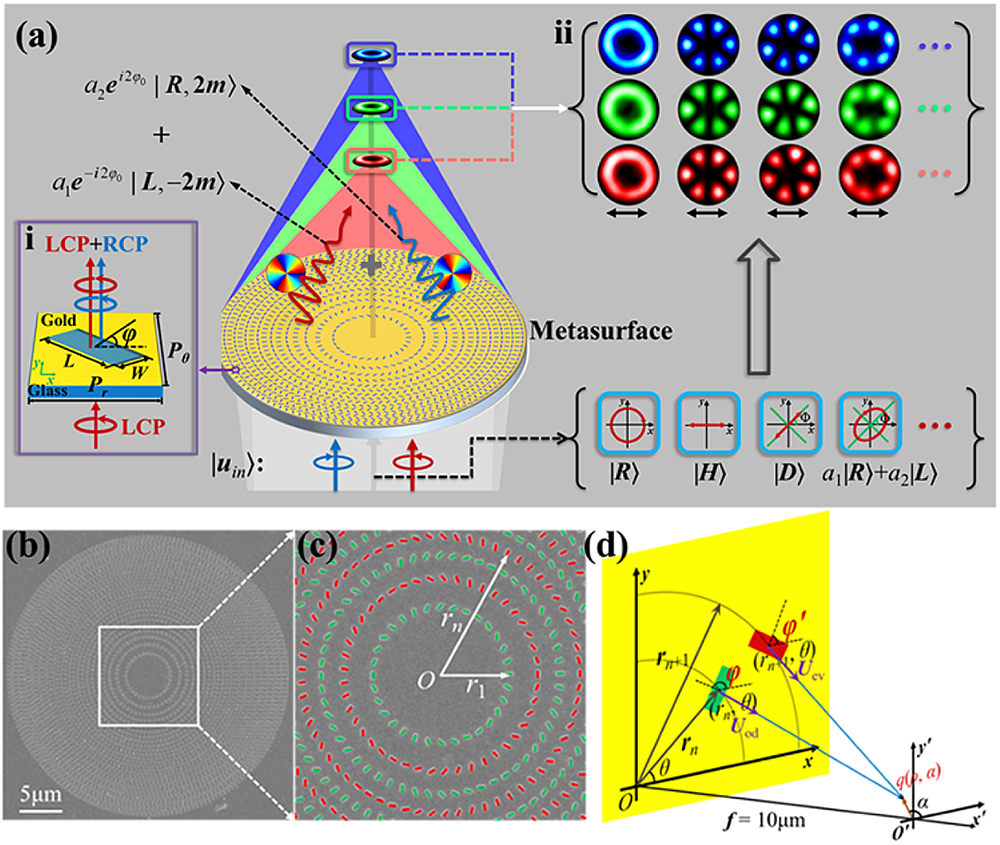
    Fig. 1. Schematic for generating the focused HOP beams via an FZ metasurface. (a) Basics for the generation of focused HOP beams. Upon illumination of incident beam of a wavelength λ (λ=632.8  nm, 532 nm, and 473 nm) with the arbitrary polarization state |uin=a1|R+a2|L described as the superposition of RCP (represented by the light blue arrow) and LCP (represented by the upward wine arrow) components, the output beam is the superposition of the LCP and RCP OAM states of |L,2m and |R,2m with weights a1 and a2, respectively. (a) Panel i, enlarged view of a representative slit. (a) Panel ii, intensity patterns of focused HOP beams generated at the center focal plane. (b) SEM image and (c) enlarged view of the FZ metasurface with geometric parameters m=3/2 and φ0=π/2. (d) Illustrative geometry for the theoretical analysis of the VB produced by the metasurface.
    Numerical simulations for the generation of the focused HOP beams. (a) Schematic and (b) simulation results of the focused RPVB and APVB. The focused solid spot with an approximately 3λ depth of focus in (b) panels i and ii verifies the generation of the focused RPVB; the hollow dark spot in (b) panels iv and v verifies the generation of the focused APVB; (b) panels iii and vi show the curves of the total and component intensities along the x direction. Itotal, total intensity; Ir, radial, Iφ, azimuthal, Iz, longitudinal component intensities. (c) Upper panel, transmitted efficiency T for the powers of the transmitted field, and the phases of the ISC and CSC of the slit in broadband. The incident light is LCP. Lower panel, Rrcp and Rlcp, representing the transmitted power ratios of RCP and LCP to the total transmitted power, respectively. (d) Panels i–iii show the simulated intensity distribution on the x–z plane. (e) Curves of the weights squared for OAM states |R, 2m⟩ (blue) and |L, −2m⟩ (red) versus the polar angle 2Θ on PS of the incident light. The curves in the inset show the corresponding weights squared of CP components |R⟩ and |L⟩ of the incident light with λ = 632.8 nm.
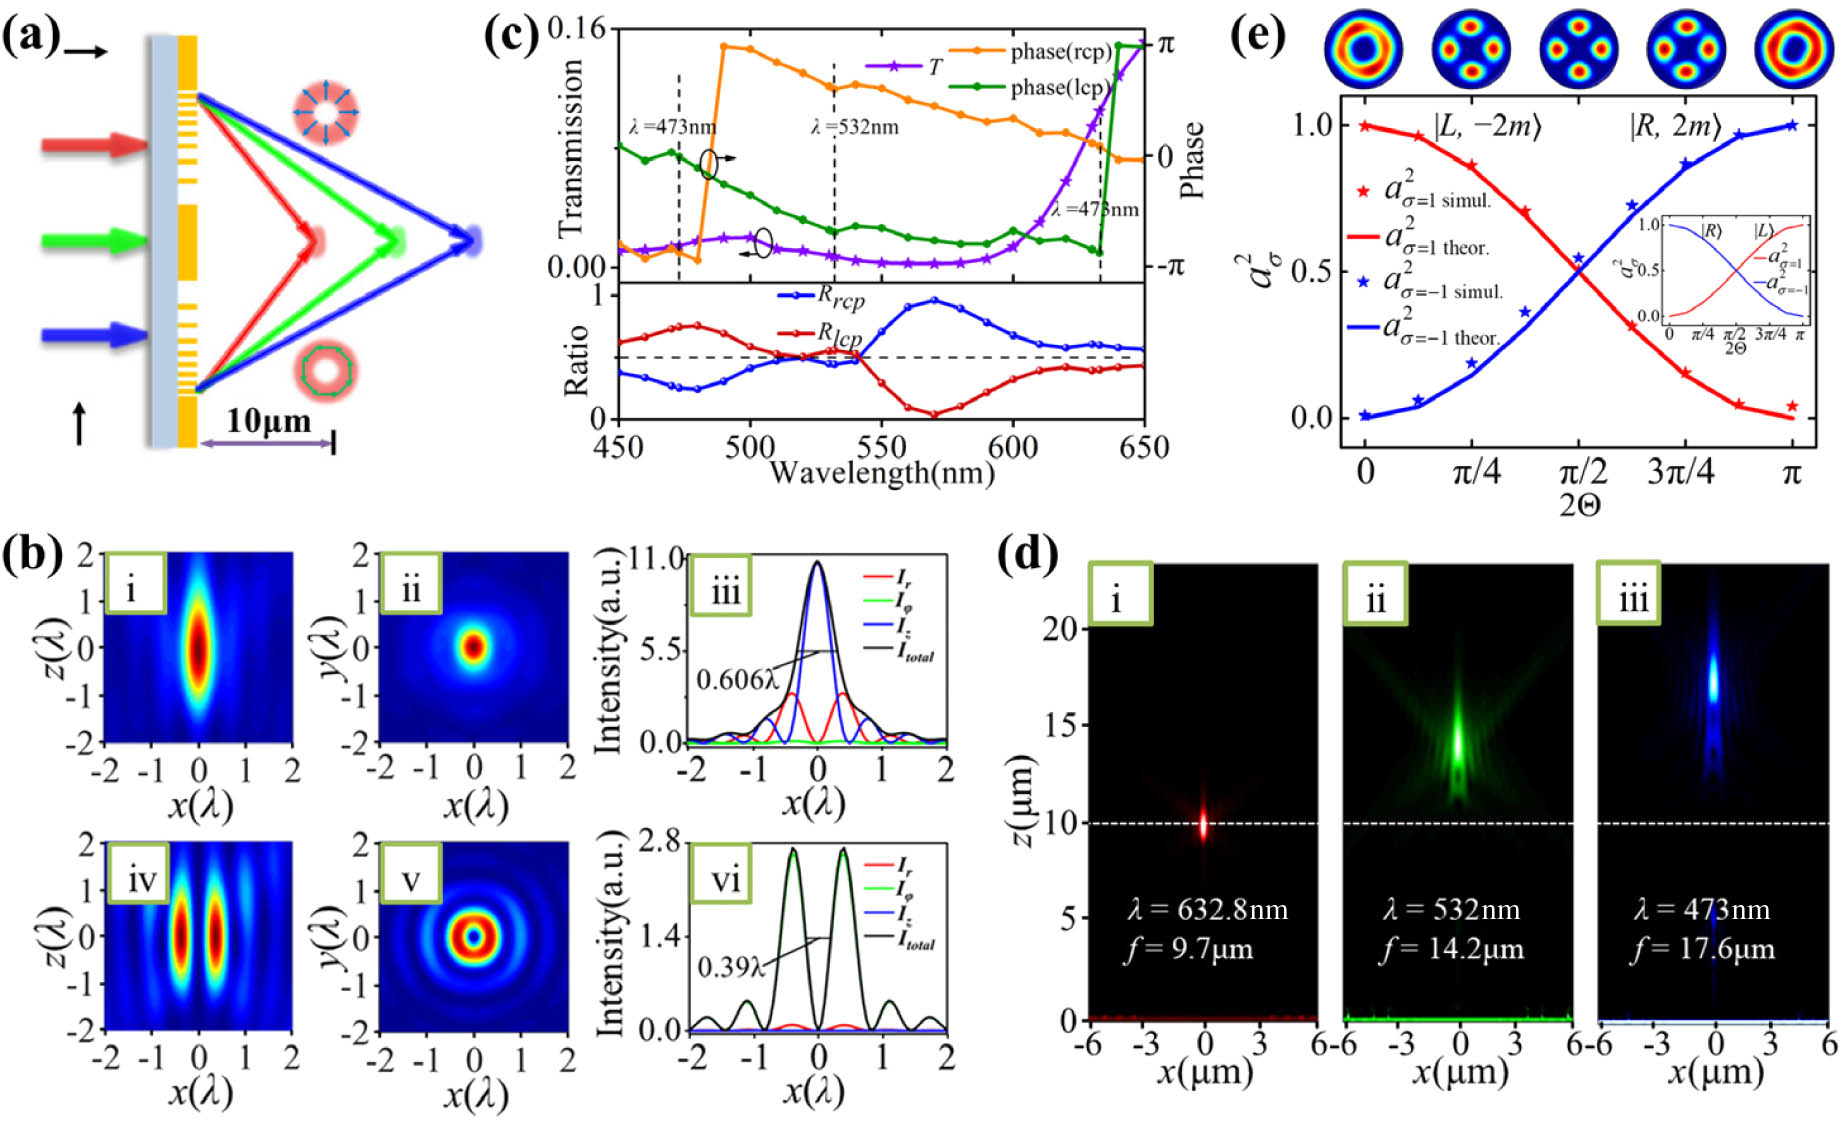
    Fig. 2. Numerical simulations for the generation of the focused HOP beams. (a) Schematic and (b) simulation results of the focused RPVB and APVB. The focused solid spot with an approximately 3λ depth of focus in (b) panels i and ii verifies the generation of the focused RPVB; the hollow dark spot in (b) panels iv and v verifies the generation of the focused APVB; (b) panels iii and vi show the curves of the total and component intensities along the x direction. Itotal, total intensity; Ir, radial, Iφ, azimuthal, Iz, longitudinal component intensities. (c) Upper panel, transmitted efficiency T for the powers of the transmitted field, and the phases of the ISC and CSC of the slit in broadband. The incident light is LCP. Lower panel, Rrcp and Rlcp, representing the transmitted power ratios of RCP and LCP to the total transmitted power, respectively. (d) Panels i–iii show the simulated intensity distribution on the x–z plane. (e) Curves of the weights squared for OAM states |R, 2m (blue) and |L, −2m (red) versus the polar angle 2Θ on PS of the incident light. The curves in the inset show the corresponding weights squared of CP components |R and |L of the incident light with λ = 632.8 nm.
    (a) Intensity patterns of APVB on the focal plane at 14 different wavelengths between 450 and 650 nm. All the patterns are in a unified color bar. (b) The focal length (red stars) and the inner FWHM (blue triangles) at different wavelengths. (c) The FWHM of the simulated APVB along the optical axis with wavelengths λ0 = 632.8, 532, and 473 nm, respectively.
    Fig. 3. (a) Intensity patterns of APVB on the focal plane at 14 different wavelengths between 450 and 650 nm. All the patterns are in a unified color bar. (b) The focal length (red stars) and the inner FWHM (blue triangles) at different wavelengths. (c) The FWHM of the simulated APVB along the optical axis with wavelengths λ0 = 632.8, 532, and 473 nm, respectively.
    (a) Schematic diagram of the experimental setup. HWP, half-wave plate; QWP, quarter-wave plate; A, attenuator; MO, microscope objective (NA=0.9/100×); P, linear polarizer. (b), (c) SEM images (local) of samples S1 and S2, respectively. (d) Schematic for the correlation of the linear polarization of light E0 and the polarization of the transmitted field E. E0x,E0y and Ex, Ey represent their component fields. (d) Panels i–iii represent the horizontally, angle -Φ-obliquely, and vertically incident polarizations, respectively, where the transmitted fields E are polarized in the horizontal direction, oblique angle Φ with respect to the inverse x direction, and vertical direction. When the polarization direction Φ of incident light E0 is rotated counterclockwise from 0 to π/2, the polarization of the transmitted field E rotates clockwise from 0 to π/2.
    Fig. 4. (a) Schematic diagram of the experimental setup. HWP, half-wave plate; QWP, quarter-wave plate; A, attenuator; MO, microscope objective (NA=0.9/100×); P, linear polarizer. (b), (c) SEM images (local) of samples S1 and S2, respectively. (d) Schematic for the correlation of the linear polarization of light E0 and the polarization of the transmitted field E. E0x,E0y and Ex, Ey represent their component fields. (d) Panels i–iii represent the horizontally, angle -Φ-obliquely, and vertically incident polarizations, respectively, where the transmitted fields E are polarized in the horizontal direction, oblique angle Φ with respect to the inverse x direction, and vertical direction. When the polarization direction Φ of incident light E0 is rotated counterclockwise from 0 to π/2, the polarization of the transmitted field E rotates clockwise from 0 to π/2.
    Experimental results of the HOP beams of order l=1 produced by sample S1 under the illumination of the red (632.8 nm), green (532 nm), and blue (473 nm) light. (a) The transformation of the polarization states from the PS (left) to HOP sphere (right) by the metasurface. (b) Intensity patterns of VBs on the equator of HOPs under the illumination of the red light. (c) and (d) Intensity patterns of VBs under the illumination of green and blue light, respectively. (e) Measured intensity patterns of nine VBs on the prime meridian of HOP sphere. The red double arrows and elliptical and round arrows represent the incident polarizations, the white arrows represent the polarization components (i.e., the direction of the polarizer) of the VBs, the doughnuts overlaid by the black elliptical (or round) and double-sided arrows of schematic polarization states are the experimental intensity patterns of I=Ix+Iy, and the gray hollow arrows mark the orientation of the lobes.
    Fig. 5. Experimental results of the HOP beams of order l=1 produced by sample S1 under the illumination of the red (632.8 nm), green (532 nm), and blue (473 nm) light. (a) The transformation of the polarization states from the PS (left) to HOP sphere (right) by the metasurface. (b) Intensity patterns of VBs on the equator of HOPs under the illumination of the red light. (c) and (d) Intensity patterns of VBs under the illumination of green and blue light, respectively. (e) Measured intensity patterns of nine VBs on the prime meridian of HOP sphere. The red double arrows and elliptical and round arrows represent the incident polarizations, the white arrows represent the polarization components (i.e., the direction of the polarizer) of the VBs, the doughnuts overlaid by the black elliptical (or round) and double-sided arrows of schematic polarization states are the experimental intensity patterns of I=Ix+Iy, and the gray hollow arrows mark the orientation of the lobes.
    Experimental intensity patterns produced by samples S2,S3, and S5, respectively. (a) Intensity patterns of the VBs at the four equator points marked from A to D. (b1), (b2) Experimental results of nine VBs evolving along the prime meridian of the HOP sphere with l=3 under the illumination of red light at λ=632.8 nm, and under the illumination of green light at λ=532 nm and blue light at λ=473 nm, respectively. The upper and lower rows are for green light (λ=532 nm) and blue light (λ=473 nm), respectively. All the horizontal white arrows represent polarization components of the VBs.
    Fig. 6. Experimental intensity patterns produced by samples S2,S3, and S5, respectively. (a) Intensity patterns of the VBs at the four equator points marked from A to D. (b1), (b2) Experimental results of nine VBs evolving along the prime meridian of the HOP sphere with l=3 under the illumination of red light at λ=632.8  nm, and under the illumination of green light at λ=532  nm and blue light at λ=473  nm, respectively. The upper and lower rows are for green light (λ=532  nm) and blue light (λ=473  nm), respectively. All the horizontal white arrows represent polarization components of the VBs.
    VQF as a function of the parameters (a) 2Θ′ and (b) slit width W. (a) VQF of the simulated HOP beams of order 2 on the prime meridian. Solid red line, theoretical VQF; blue stars, VQF for sample S2; green triangle, VQF for sample Sa′. The upper and lower patterns of HOP beams are for S2 and Sa′ at 2Θ′=3π/4, respectively. (b) VQF for FZ metasurface samples Sb1′−Sb7′ of slit width varying from 90 nm to 150 nm at 2Θ′=π/4.
    Fig. 7. VQF as a function of the parameters (a) 2Θ and (b) slit width W. (a) VQF of the simulated HOP beams of order 2 on the prime meridian. Solid red line, theoretical VQF; blue stars, VQF for sample S2; green triangle, VQF for sample Sa. The upper and lower patterns of HOP beams are for S2 and Sa at 2Θ=3π/4, respectively. (b) VQF for FZ metasurface samples Sb1Sb7 of slit width varying from 90 nm to 150 nm at 2Θ=π/4.
    Xiangyu Zeng, Yuqin Zhang, Manna Gu, Zijun Zhan, Ruirui Zhang, Yu Zhang, Rui Sun, Changwei He, Chunxiang Liu, Chuanfu Cheng. Arbitrary manipulations of focused higher-order Poincaré beams by a Fresnel zone metasurface with alternate binary geometric and propagation phases[J]. Photonics Research, 2022, 10(4): 1117
    Download Citation