• Photonics Research
  • Vol. 3, Issue 1, 24 (2015)
Jianyong Hu, Yan Liu, Lingling Liu, Bo Yu, Guofeng Zhang, Liantuan Xiao*, and and Suotang Jia
Author Affiliations
  • State Key Laboratory of Quantum Optics and Quantum Optics Devices, Institute of Laser Spectroscopy, Shanxi University, Taiyuan 030006, China
  • show less
    DOI: 10.1364/PRJ.3.000024 Cite this Article Set citation alerts
    Jianyong Hu, Yan Liu, Lingling Liu, Bo Yu, Guofeng Zhang, Liantuan Xiao, and Suotang Jia. Quantum description and measurement for single photon modulation[J]. Photonics Research, 2015, 3(1): 24 Copy Citation Text show less
    Schematic diagram of the single photon modulation process: (a) single photons appear randomly without modulation; (b) distribution of single photons’ timing sequence changed with the modulation; (c) statistics diagram of Δti; (d) probability distribution of single photons which follows the sine distribution (dashed line indicates the probability distribution).
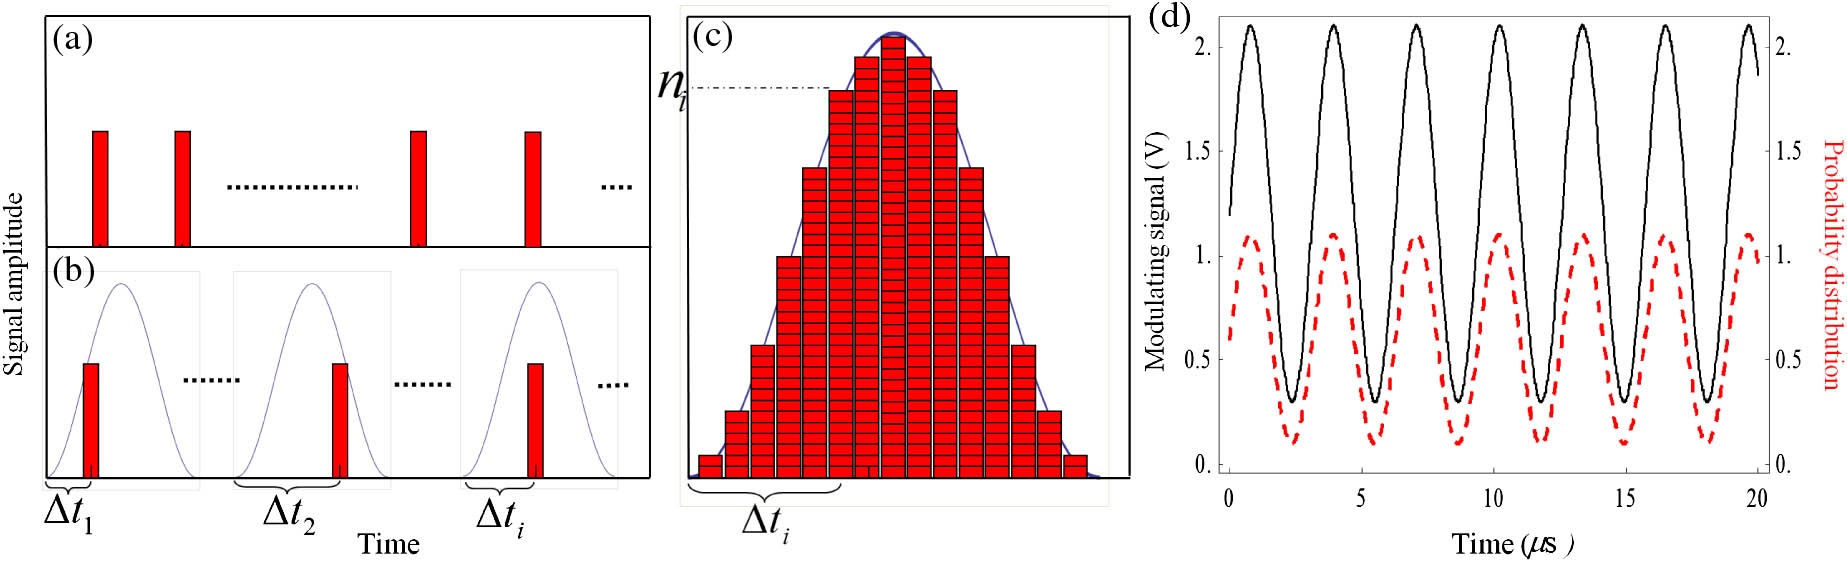
    Fig. 1. Schematic diagram of the single photon modulation process: (a) single photons appear randomly without modulation; (b) distribution of single photons’ timing sequence changed with the modulation; (c) statistics diagram of Δti; (d) probability distribution of single photons which follows the sine distribution (dashed line indicates the probability distribution).
    Simulation results of single photon modulation: (a) spectrum has the characteristic of white noise without modulatinon; (b) with the modulation signal, there is a peak at the modulation frequency; inset, enlargement of the rectangular region within the dashed line.
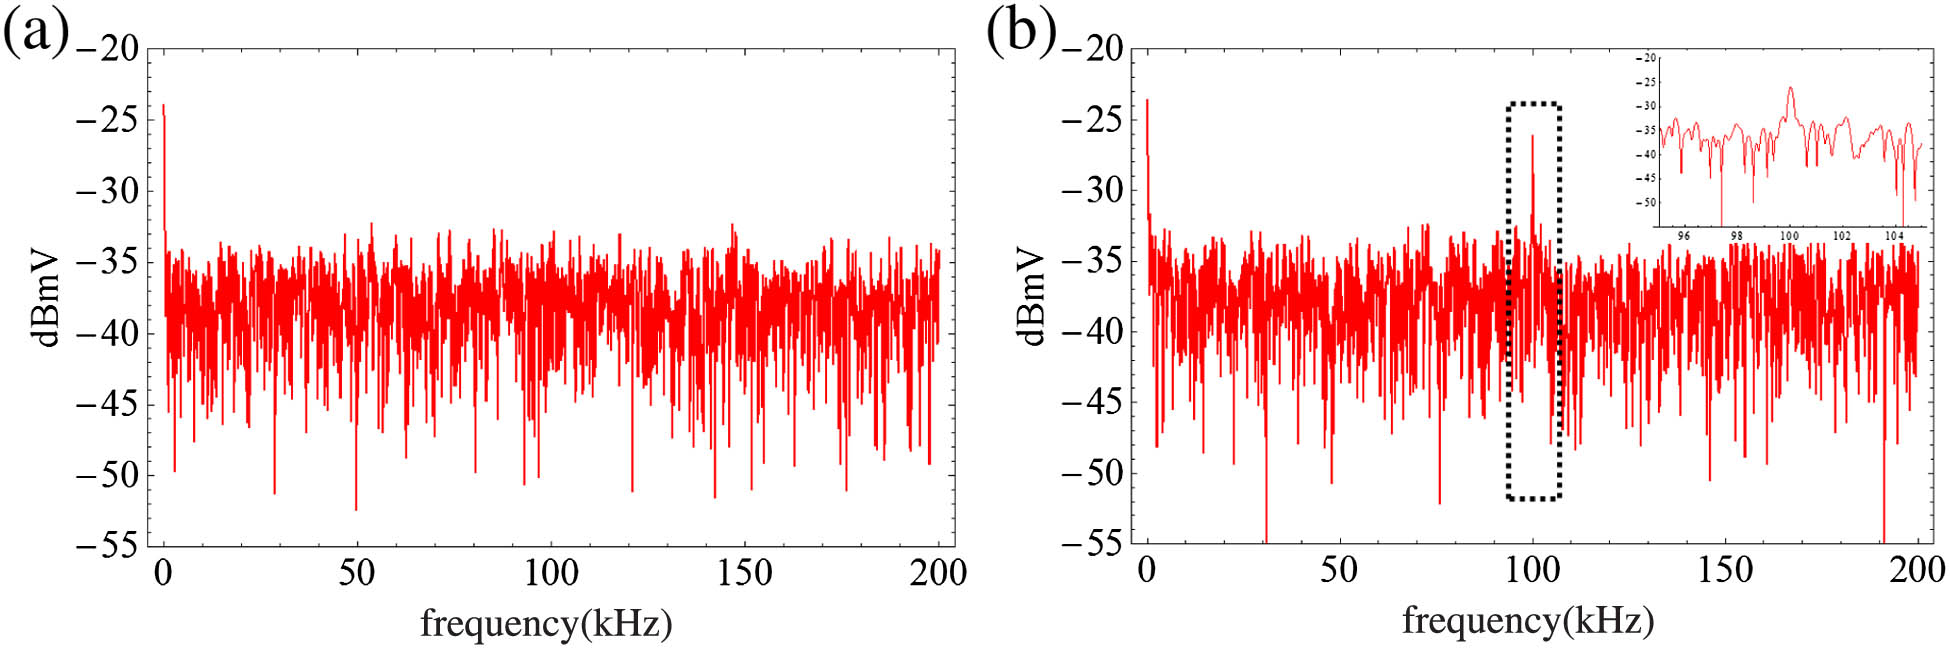
    Fig. 2. Simulation results of single photon modulation: (a) spectrum has the characteristic of white noise without modulatinon; (b) with the modulation signal, there is a peak at the modulation frequency; inset, enlargement of the rectangular region within the dashed line.
    Experimental setup of single photon modulation: red and black lines indicate the optical fiber and electric cable, respectively; Att, optical attenuator; Iso, optical isolator; SPAD, single-photon avalanche diode.
    Fig. 3. Experimental setup of single photon modulation: red and black lines indicate the optical fiber and electric cable, respectively; Att, optical attenuator; Iso, optical isolator; SPAD, single-photon avalanche diode.
    Statistics diagram of the phase difference between the single-photon signal and the modulation signals in the time domain. Horizontal ordinate is calculated as P=Δti/T0. Mean photon number is 80 kcps; modulation signal frequency is 100 kHz, which means there are 0.8 photons in each modulation period on average.
    Fig. 4. Statistics diagram of the phase difference between the single-photon signal and the modulation signals in the time domain. Horizontal ordinate is calculated as P=Δti/T0. Mean photon number is 80 kcps; modulation signal frequency is 100 kHz, which means there are 0.8 photons in each modulation period on average.
    (a1) Theoretical results, relationship between the mean photon number and the spectrum (peak and background); (a2) experimental results, relationship between the mean photon number and the spectrum (peak and background); spectrum signal improved over 24 dBm when the mean photon number was 300 kcps; (b1) theoretical results, SNR with different mean photon numbers; (b2) experimental results, SNR with different mean photon numbers.
    Fig. 5. (a1) Theoretical results, relationship between the mean photon number and the spectrum (peak and background); (a2) experimental results, relationship between the mean photon number and the spectrum (peak and background); spectrum signal improved over 24 dBm when the mean photon number was 300 kcps; (b1) theoretical results, SNR with different mean photon numbers; (b2) experimental results, SNR with different mean photon numbers.
    (a) Relationship between the modulation frequency and the signal and background intensity; (b) SNR corresponds to the modulation frequency; red and black points represent experimental and theoretical results, respectively; mean photon number was set to 80 kcps.
    Fig. 6. (a) Relationship between the modulation frequency and the signal and background intensity; (b) SNR corresponds to the modulation frequency; red and black points represent experimental and theoretical results, respectively; mean photon number was set to 80 kcps.
    Jianyong Hu, Yan Liu, Lingling Liu, Bo Yu, Guofeng Zhang, Liantuan Xiao, and Suotang Jia. Quantum description and measurement for single photon modulation[J]. Photonics Research, 2015, 3(1): 24
    Download Citation