Abstract
Single photon modulation has been proposed to overcome the defects of the low signal-to-noise ratio (SNR) and slow process rate of photon counting. In this paper, we present the quantum theory of single photon modulation, and then experimentally investigate the modulation spectroscopy both in the time domain and frequency domain. It is found that the SNR reached 150 in approximately the MHz modulation bandwidth.1. INTRODUCTION
As far back as 1939, Allen implemented the experiment of photon counting with a secondary electron multiplier [1]. Compared with the traditional analog detection methods, photon counting has a higher signal-to-noise ratio (SNR) [2–5]. In a perfect photon-counting measurement, the optimal SNR can reach (where is the mean photon number within a bin time) [6], which indicates that the SNR decreases rapidly with a decrease of the mean photon number. However, considering the effects of dark count and low detection efficiency of a single-photon detector, photon counting presents difficulties with respect to the requirement of high SNR detection.
Photon-counting modulation [7–13] has been used in plasma diagnostics, fluorescence detection, fluorescence lifetime measurement of single molecules, optical time domain reflectometry, spectral measurements, and so on. To obtain a precise phase signal, photon counts were reconverted to analog signals that feed into an analog lock-in amplifier. In [14,15], we demonstrated that photon-counting modulation can effectively improve the SNR of single-photon detection. However, the modulation frequency is limited by the slow processing speed of photon counting. Due to the averaging effect of photon counting, the dynamics information of the single-photon source would be lost [16]. Furthermore, the low modulation frequency (less than 10 Hz) may be adversely affected by flicker noise ( noise).
Recently, we presented a single photon modulation method to increase the SNR and speed up the processing rate for low-light-level detection. Compared with the common photon-counting method [17], the modulation frequency was shown to be up to 100 kHz.
Sign up for Photonics Research TOC. Get the latest issue of Photonics Research delivered right to you!Sign up now
In this paper, we present the quantum theory of single-photon modulation, and then experimentally investigate the modulation effects from both the time domain and frequency domain. The modulation frequency we achieved experimentally is in the MHz range, and further theoretical simulation shows a similar SNR within the GHz modulation bandwidth.
2. THEORETICAL MODEL
Modulation signal can be represented as a function of time . Express the voltage response of intensity modulator transmittance as , so the transmittance is a function that depends on the modulation signal. We express the timing sequence, which is in accordance with the Poisson distribution, before and after passing through the intensity modulator, as and , respectively. The probability of a photon passing through the intensity modulator is determined by the modulation signal . Then, after the modulation .
In a quantum mechanics model, two incident beams are necessary, although one of them is in a vacuum state (as per the quantum optics splitter model). Consider the case in which the signal state and the vacuum state are single modes with annihilation operators and , respectively. The annihilation operators and represent emission and absorption processes, respectively. Their relationship can be expressed as The transformation process of the incident state is where is a shift operator, and the definition formulas are It is thus clear that the mean number of photons that emerge from the intensity modulator is Considering that the is the vacuum state, thus
As shown in Fig. 1, the spectrum of modulated photons corresponds to the timing sequence distribution of the photons. The optical signal distribution in the time domain was changed by modulating the single photons directly with an intensity modulator.
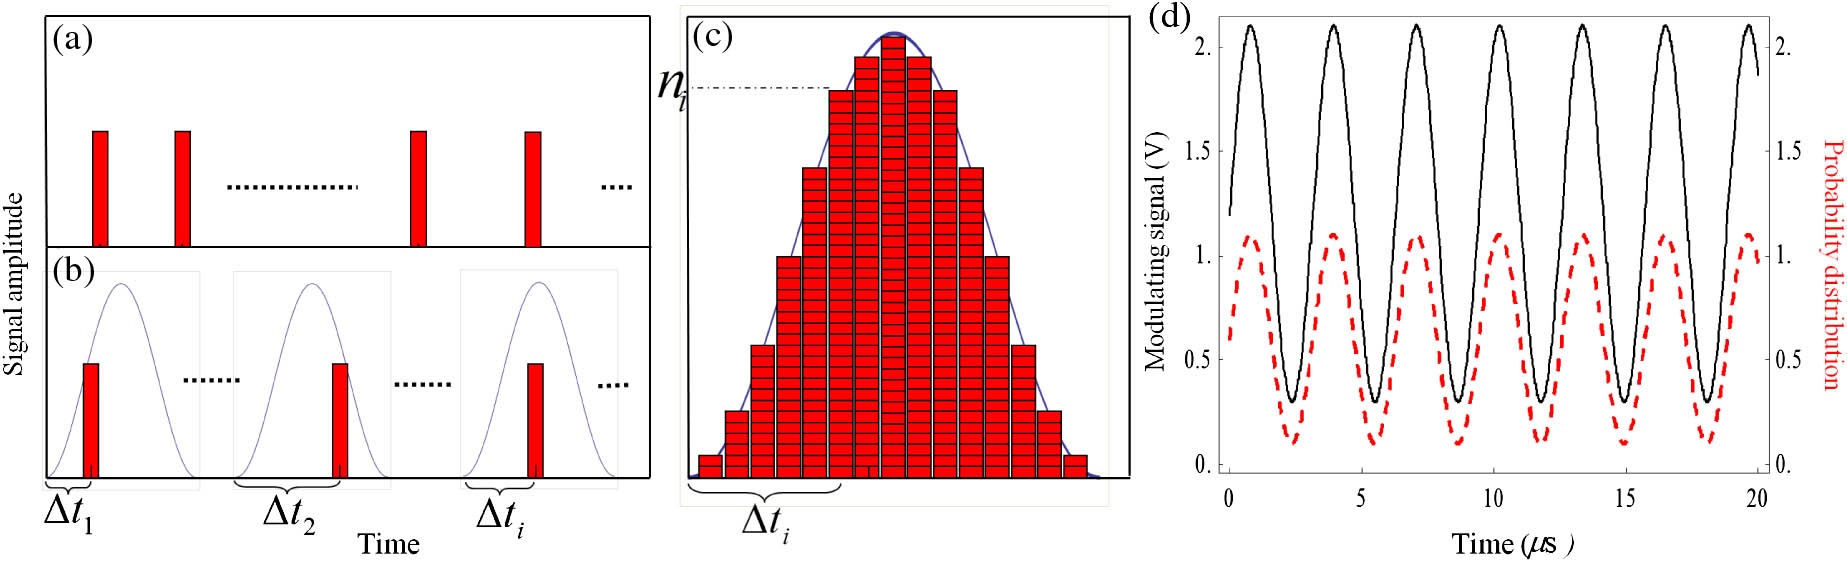
Figure 1.Schematic diagram of the single photon modulation process: (a) single photons appear randomly without modulation; (b) distribution of single photons’ timing sequence changed with the modulation; (c) statistics diagram of ; (d) probability distribution of single photons which follows the sine distribution (dashed line indicates the probability distribution).
We define as the relative difference between the single-photon signal arrival time and the trough of the modulation signal. Take a sine-wave modulation signal with period as an example. The maximum probability of appears at . Then, we calculated the spectrum with and without the modulation, as shown in Fig. 2. Here we set the modulation frequency at 100 kHz, and the mean photon number is 80 kilo counts per second (kcps). The trigger rate of the single-photon detector is 5 MHz, which means there are 0.016 photons in each pulse. When the mean photon number in each pulse is small enough (), the influence from the multiphoton events can be ignored.

Figure 2.Simulation results of single photon modulation: (a) spectrum has the characteristic of white noise without modulatinon; (b) with the modulation signal, there is a peak at the modulation frequency; inset, enlargement of the rectangular region within the dashed line.
3. EXPERIMENTAL SETUP
The experimental system is described in Fig. 3. The single-photon source was composed of a continuous-wave laser (1550 nm, NP Photonics RELS) and a continuously adjustable optical attenuator. The single photons were modulated by an intensity modulator (MACH-10). The modulation signal was generated by a function generator, the peak-to-peak voltage , and the offset voltage . A single-photon detector (QCD300) was externally triggered by a square-wave signal with a 5 MHz repetition rate generated by a pulse generator (SRS DG645). The output of the single-photon detector was the standard square-wave pulse with amplitude 3 V. A spectrum analyzer (SA, Agilent E4402B) was used for signal analysis in the frequency domain.
Figure 3.Experimental setup of single photon modulation: red and black lines indicate the optical fiber and electric cable, respectively; Att, optical attenuator; Iso, optical isolator; SPAD, single-photon avalanche diode.
4. RESULTS AND DISCUSSION
First let us analyze the effect of the modulation on single photons in the time domain. As we expected the statistical result of the probability distribution coincides with a sine waveform (Fig. 4). The highest probability appears at the peak of the sine wave. Because of shot noise, the photon number distribution cannot follow the sine waveform distribution perfectly. For a sufficiently large number of photons and sufficiently small width of the time interval, the modulation signal shape can be derived from the data with a SNR close to the ideal value .
Figure 4.Statistics diagram of the phase difference between the single-photon signal and the modulation signals in the time domain. Horizontal ordinate is calculated as . Mean photon number is 80 kcps; modulation signal frequency is 100 kHz, which means there are 0.8 photons in each modulation period on average.
Next, we analyze the modulation on single photons in the frequency domain. Some factors affect the spectrum measured by the spectrum analyzer, such as the intensity of the single-photon source, the fluctuation of the photon counts, the modulation frequency, and so on. By analyzing the modulation spectrum, we found that both the peak and background of the modulation spectrum increase with the increase of the mean photon number. It is common sense that as the input power increases, the power spectrum would also increase. The experimental and theoretical results show that the SNR also increased as the mean photon number increased. The experimental results have a statistical property at the single-photon level. With the increase of the mean photon number the statistical results tend to be impeccable; the influence of the dark count and the shot noise decreased naturally. The SNR increases with the increase of the mean photon number, and then tends to be relatively stable. This means that when the mean photon number is large enough the effect caused by shot noise can be negligible, and the SNR would also not increase anymore. The experimental results demonstrate that the interpretation previously mentioned is reasonable (Fig. 5).
Figure 5.() Theoretical results, relationship between the mean photon number and the spectrum (peak and background); () experimental results, relationship between the mean photon number and the spectrum (peak and background); spectrum signal improved over 24 dBm when the mean photon number was 300 kcps; () theoretical results, SNR with different mean photon numbers; () experimental results, SNR with different mean photon numbers.
The definition of SNR is where is the signal power, and is noise power per Hz.
Figure 6(a) shows the experimental results for the spectrum of the signal peak and background as a function of the modulation frequency. Both the simulation and experimental results show a similar SNR at different modulation frequencies, as is shown in Fig. 6(b).
Figure 6.(a) Relationship between the modulation frequency and the signal and background intensity; (b) SNR corresponds to the modulation frequency; red and black points represent experimental and theoretical results, respectively; mean photon number was set to 80 kcps.
The vertical error bar in Fig. 6 was caused by the fluctuation of the photon counts. Limited by the intensity modulator response rate, there are only simulation results at the high modulation frequency section in Fig. 6(b). The theoretical SNR is a little higher than the experimental result because of the excess noise in practice.
5. CONCLUSION
In summary, we described the single photon modulation process in the manner of quantum optics. The experimental results show that this method has a higher SNR than that of the direct photon-counting measurement. Compared with the slow modulation frequency of photon-counting modulation, single photon modulation makes it possible to obtain quick measurement of a single-photon signal. MHz modulation bandwidth could effectively avoid the infections from flicker noise and reduce the measurement time. These results indicate that single photon modulation has potential applications in weak light detection and information transmission at the single-photon level.
References
[1] J. S. Allen. The detection of single positive ions, electrons and photons by a secondary electron multiplier. Phys. Rev., 55, 966-971(1939).
[2] S. S. Raouf, A. R. Sadik, N. K. Wafi, K. M. Aboud. Measurement of noise power spectrum in photon counting PMT’s and the effect of the observed (1/f) noise on astronomical photometry. Astrophys. Space Sci., 127, 207-218(1986).
[3] L. You, X. Shen, X. Yang. Single photon response of superconducting nanowire single photon detector. Chin. Sci. Bull., 55, 441-445(2010).
[4] B. Tavakoli, B. Javidi, E. Watson. Three dimensional visualization by photon counting computational integral imaging. Opt. Express, 16, 4426-4436(2008).
[5] M. A. Albota, B. S. Robinson. Photon-counting 1.55 μm optical communications with pulse-position modulation and a multimode upconversion single-photon receiver. Opt. Lett., 35, 2627-2629(2010).
[6] D. Rosenberg, A. E. Lita, A. J. Miller, S. W. Nam. Noise-free high-efficiency photon-number-resolving detectors. Phys. Rev. A, 71, 061803(R)(2005).
[7] B. Pelissier, N. Sadeghi. Time-resolved pulse-counting lock-in detection of laser induced fluorescence in the presence of a strong background emission. Rev. Sci. Instrum., 67, 3405-3410(1996).
[8] F. Zhang, G. Zhang, R. Chen, X. Wang, L. Xiao, S. Jia. Modulation of the fluorescence intensity of single squaraine-derived rotaxane molecules by an electric field. Phys. Scr., 82, 055303(2010).
[9] C. Brunel, B. Lounis, P. Tamarat, M. Orrit. Triggered source of single photons based on controlled single molecule fluorescence. Phys. Rev. Lett., 83, 2722-2725(1999).
[10] T. Iwata, A. Hori, T. Kamada. Photon-counting phase-modulation fluorometer. Opt. Rev., 8, 326-330(2001).
[11] J. A. Koningstein, R. G. Smith. Continuous recording of raman spectra excited with the He-Ne gas laser. J. Opt. Soc. Am., 54, 1061-1062(1964).
[12] X. Wang, J. Wang, G. Zhang, L. Xiao, S. Jia. Photon counts modulation in optical time domain reflectometry. Chin. Phys. B, 20, 064204(2011).
[13] R. Chen, G. Zhang, Y. Gao, L. Xiao, S. Jia. Single molecules probe the polarization dynamics of poly (methyl methacrylate) in external electric field. Appl. Phys. Lett., 100, 203118(2012).
[14] X. Wang, J. Wang, B. He, L. Xiao, S. Jia. Photon counting optical time domain reflectometry applying a single photon modulation technique. Chin. Phys. Lett., 28, 070302(2011).
[15] T. Huang, S. Dong, X. Guo, L. Xiao, S. Jia. Singnal-to-noise ratio improvement of photon counting using wavelength modulation spectroscopy. Appl. Phys. Lett., 89, 061102(2006).
[16] J. W. Goodman. Statistical Optics(2000).
[17] X. Wang, G. Zhang, R. Chen, Y. Gao, L. Xiao, S. Jia. Detection efficiency enhancement of single-photon detector at 1.55-μm by using of single photon lock-in and optimal threshold. Opt. Laser Technol., 44, 1773-1775(2012).


