• Matter and Radiation at Extremes
  • Vol. 7, Issue 3, 036902 (2022)
B. Albertazzi1、a), P. Mabey2, Th. Michel1, G. Rigon1, J. R. Marquès1, S. Pikuz3、4, S. Ryazantsev3、4, E. Falize5, L. Van Box Som5, J. Meinecke6, N. Ozaki7、8, G. Gregori6, and M. Koenig1、7
Author Affiliations
  • 1LULI–CNRS, CEA, Sorbonne Universités, École Polytechnique, Institut Polytechnique de Paris, F-91120 Palaiseau cedex, France
  • 2Department of Physics, Freie Universität Berlin, 14195 Berlin, Germany
  • 3JIHT-RAS, 13-2 Izhorskaya st., Moscow 125412, Russia
  • 4National Research Nuclear University “MEPhI,” Moscow 115409, Russia
  • 5CEA-DAM-DIF, F-91297 Arpajon, France
  • 6Clarendon Laboratory, University of Oxford, Parks Road, Oxford OX1 3PU, United Kingdom
  • 7Graduate School of Engineering, Osaka University, Suita, Osaka 565-0871, Japan
  • 8Institute of Laser Engineering, Osaka University, Suita, Osaka 565-0871, Japan
  • show less
    DOI: 10.1063/5.0068689 Cite this Article
    B. Albertazzi, P. Mabey, Th. Michel, G. Rigon, J. R. Marquès, S. Pikuz, S. Ryazantsev, E. Falize, L. Van Box Som, J. Meinecke, N. Ozaki, G. Gregori, M. Koenig. Triggering star formation: Experimental compression of a foam ball induced by Taylor–Sedov blast waves[J]. Matter and Radiation at Extremes, 2022, 7(3): 036902 Copy Citation Text show less
    Illustration of the evolution of a massive molecular cloud, indicating the importance of SNR propagation in forming new stars.
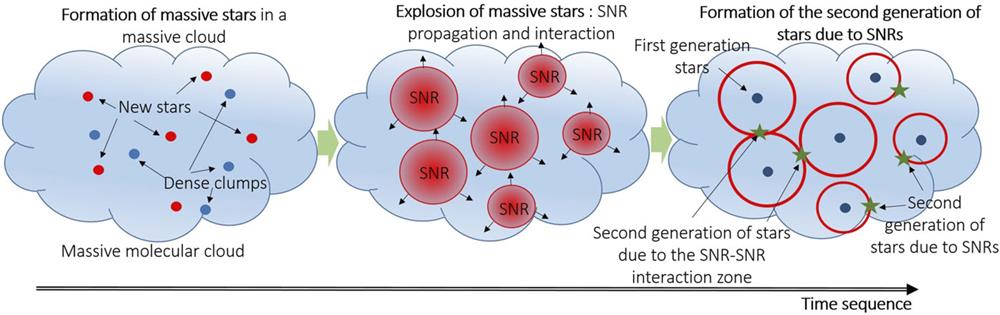
    Fig. 1. Illustration of the evolution of a massive molecular cloud, indicating the importance of SNR propagation in forming new stars.
    Experimental setup for N2 at 11.4 mbar. Not to scale.
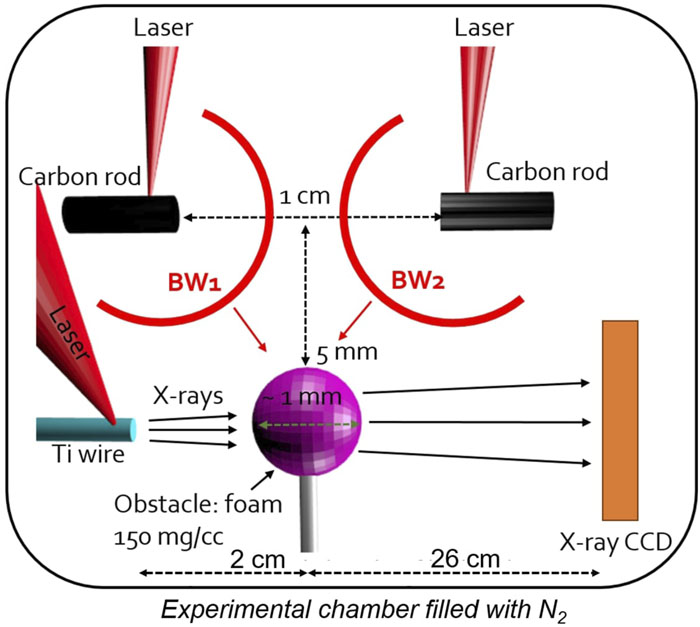
    Fig. 2. Experimental setup for N2 at 11.4 mbar. Not to scale.
    Experimental results in N2 at 11.4 mbar. (a) Expansion of a single BW, taken 100 ns after the main pulse, toward the obstacle located 7.07 mm from the carbon rod. (b) Expansion of a single BW, taken at 450 ns, toward the obstacle located 11 mm from the carbon rod. (c) Zoom of (b) showing the deviation of the morphology of the BW from spherical to nonspherical when interacting with the foam ball. (d) Interferogram corresponding to (a). (e) Simulated interferogram. (f) Electron density profile corresponding to (f). (g) Experimental BW radius R vs time taken as illustrated in (a), i.e., parallel to the rod orientation. (h) Instantaneous velocity deduced from radius measurements vs time.
    Fig. 3. Experimental results in N2 at 11.4 mbar. (a) Expansion of a single BW, taken 100 ns after the main pulse, toward the obstacle located 7.07 mm from the carbon rod. (b) Expansion of a single BW, taken at 450 ns, toward the obstacle located 11 mm from the carbon rod. (c) Zoom of (b) showing the deviation of the morphology of the BW from spherical to nonspherical when interacting with the foam ball. (d) Interferogram corresponding to (a). (e) Simulated interferogram. (f) Electron density profile corresponding to (f). (g) Experimental BW radius R vs time taken as illustrated in (a), i.e., parallel to the rod orientation. (h) Instantaneous velocity deduced from radius measurements vs time.
    Comparison between PrismSPECT simulations and experimental data averaged between 138 and 162 ns, corresponding to the time of impact with the obstacle. The simulations were performed with an initial mass density ρ = 5 × 10⁻⁵ g/cm3. The best agreement is found for a temperature in the range of 4.5–4.9 eV.
    Fig. 4. Comparison between PrismSPECT simulations and experimental data averaged between 138 and 162 ns, corresponding to the time of impact with the obstacle. The simulations were performed with an initial mass density ρ = 5 × 10⁻⁵ g/cm3. The best agreement is found for a temperature in the range of 4.5–4.9 eV.
    X-ray radiographs of the 150 mg/cm3 foam ball: (a) without the influence of a BW, for reference; (b) at t = 500 ns after the beginning of the main laser pulse.
    Fig. 5. X-ray radiographs of the 150 mg/cm3 foam ball: (a) without the influence of a BW, for reference; (b) at t = 500 ns after the beginning of the main laser pulse.
    (a) Schlieren data showing the expansion of both BWs toward the obstacle t = 100 ns after the beginning of the interaction. The thin red arrow indicates the expansion of the interaction zone formed by the collision of the two BWs. (b)–(g) Corresponding x-ray radiographs of the 150 mg/cm3 foam ball at different times during the interaction: (b) without the influence of a BW; (c) at 300 ns; (d) at 500 ns; (e) at 700 ns; (f) at 1000 ns; (g) at 1500 ns. The green arrows in (c) show the trajectories of the two BWs.
    Fig. 6. (a) Schlieren data showing the expansion of both BWs toward the obstacle t = 100 ns after the beginning of the interaction. The thin red arrow indicates the expansion of the interaction zone formed by the collision of the two BWs. (b)–(g) Corresponding x-ray radiographs of the 150 mg/cm3 foam ball at different times during the interaction: (b) without the influence of a BW; (c) at 300 ns; (d) at 500 ns; (e) at 700 ns; (f) at 1000 ns; (g) at 1500 ns. The green arrows in (c) show the trajectories of the two BWs.
    (a) Deformation of the foam. The inset shows the different ways measurements were performed. (b) Mass density retrieved from the data shown in Fig. 6 (here 0 corresponds to the middle of the foam).
    Fig. 7. (a) Deformation of the foam. The inset shows the different ways measurements were performed. (b) Mass density retrieved from the data shown in Fig. 6 (here 0 corresponds to the middle of the foam).
    ParameterSymbolLULI experimentAstrophysical system
    Propagation mediumNature of gasN2
    Initial densityρi,i1.34 × 10−5 g/cm30.1–105 cm−3
    Density ratioχ∼1 × 10410–105
    Blast waveShock velocity at impactvb,sh21 km/s10–3000 km/s
    Shock front density at impactρb,i5 × 10−5 g/cm3
    Mach numberM1–101–100
    Postshock intercloud temperatureTb,sh∼4–5 eV1 up to ∼2000 eV
    CloudCloud radiusRc475 µm0.01–200 pc
    Preshock cloud densityρc,i(60–500) × 10−3 g/cm31–500 cm−3
    Shock cloud velocityvc,sh0.2 km/s0.03–1000 km/s
    Characteristic timescalesCloud crushing timescaleτcc2375 ns1 × 104–1 × 10⁵ yr
    Pressure variation timescaleτp30 ns1 × 103–1 × 10⁴ yr
    Cooling timescaleτcool≥1000 ns100–1000 yr
    Comparison of characteristic timescalesτcc vs τcoolτccτcoolτccτcool (radiative)
    τcc vs τpτccτpτccτp
    Table 1. Summary of experimental and astrophysical parameters. Astrophysical data for the SNRs are taken from Ref. 32.
    B. Albertazzi, P. Mabey, Th. Michel, G. Rigon, J. R. Marquès, S. Pikuz, S. Ryazantsev, E. Falize, L. Van Box Som, J. Meinecke, N. Ozaki, G. Gregori, M. Koenig. Triggering star formation: Experimental compression of a foam ball induced by Taylor–Sedov blast waves[J]. Matter and Radiation at Extremes, 2022, 7(3): 036902
    Download Citation