
B. Albertazzi, P. Mabey, Th. Michel, G. Rigon, J. R. Marquès, S. Pikuz, S. Ryazantsev, E. Falize, L. Van Box Som, J. Meinecke, N. Ozaki, G. Gregori, M. Koenig. Triggering star formation: Experimental compression of a foam ball induced by Taylor–Sedov blast waves[J]. Matter and Radiation at Extremes, 2022, 7(3): 036902
- Matter and Radiation at Extremes
- Vol. 7, Issue 3, 036902 (2022)
Abstract
I. INTRODUCTION
Over the past two decades, high-power laser facilities have advanced our understanding of physical processes occurring in the Universe through the relatively new field of laboratory astrophysics.1 Conventional techniques such as numerical simulations and astronomical observations are unable to tackle some astrophysical questions. In the case of the former, this is often due to the complexity and/or interplay of the physical mechanisms involved, while for the latter, the low spatial and temporal resolutions of the observations are the limiting factors. For these reasons, scaled experiments are useful to investigate the microphysics involved in long-range astrophysical systems. One such area of interest concerns the interaction between a molecular cloud and an external agent [e.g., a supernova remnant (SNR), plasma jet, radiation, or another cloud]. This process influences the star formation rate within a galaxy and therefore its overall evolution. This phenomenon, called triggered star formation (TSF), has been shown to be an important means by which stars are formed, for example in the Elephant’s Trunk Nebula (IC 1396A).2 However, it has not yet been investigated in sufficient detail.
TSF can be summarized as follows. Unstable molecular clouds have the potential to transform into stars3 through different mechanisms involving turbulence,4 magnetic fields,5 and self-gravity. However, stable clouds, i.e., those in hydrostatic equilibrium (non-self-gravitating), can also form stars, if they interact with supersonic flows such as SNRs, stellar winds, or other molecular clouds. After impact, the clouds are compressed, leading to the onset of star formation.6,7 This phenomenon is particularly important because (i) it injects into the system short-lived radioactive isotopes (SLRIs: 26Al and 60Fe), which can subsequently be found in planetary interiors,8 (ii) it explains the formation and impact of massive OB stars (M > 10 M⊙) on their surrounding environment,9,10 and (iii) it changes the star formation rate and history by either inhibiting or increasing the formation of new stars from primordial molecular clouds.
Many astrophysical studies aimed at observing the ability of a blast wave (BW) or stellar wind to inject material into a stable cloud and initiate its collapse have already been performed (see, e.g., Refs. 7, 8, 11–13). All of these approaches have relied on the use of numerical simulations. However, it is particularly difficult to take into account all phenomena occurring during the impact of the shock with the cloud, since this involves a complex interaction of flows. For example, historical simulations14–17 did not take into consideration all the physics involved, mainly because of the two-dimensional (2D) geometry used. Indeed, 3D simulations are required to detect the complex behavior of such systems. In addition, the dynamics of a transmitted shock inside an object is relevant to many other areas of physics,18 such as high-energy-density physics (HEDP) and inertial confinement fusion (ICF).19
In this paper, we study how laser-generated BWs, analogs of SNRs, are able to launch a compression/shock wave inside a foam ball, an analog of a dense clump within a molecular cloud. Laser-generated BWs of this type have already been shown to be a good analog of SNRs (see Ref. 20 and reference therein), allowing the study of the microphysics involved in those systems.
The remainder of the paper is organized as follows. Section II is dedicated to the link between the experimental parameters and the astrophysical case. Section III describes the experiment designed to reproduce the interaction of SNRs with a molecular cloud. In Sec. IV, we present the results for the interaction of one BW with a foam ball, while in Sec. V, we focus on the interaction of two BWs with a foam ball, reproducing a different astrophysical situation. Finally, in Sec. VI, we present our conclusions that our platform can simulate an important part of the TSF process in the laboratory, although several limitations exist.
II. EXPERIMENTAL PARAMETERS AND COMPARISON WITH ASTROPHYSICS
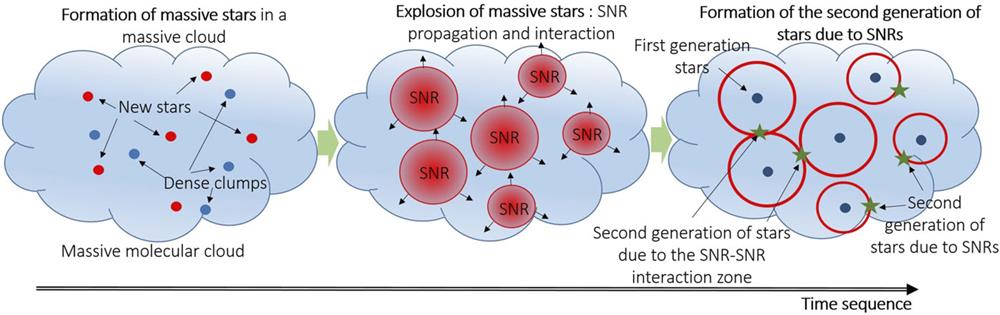
The development of an experimental platform to study the processes involved in the compression induced by the interaction of SNRs with a dense clump are presented here. When a shock wave interacts with a small object (a dense clump in astrophysics and a foam ball in our experiment), it triggers a weak reflected shock that propagates backward in the propagation medium [the interstellar medium (ISM) in astrophysics and a gas in the experiment]. We note, however, that this will be too weak to be observed by our experimental diagnostics. Of interest to us is the slower compression/shock wave that is transmitted inside the object, compressing it and thus rendering it unstable and leading to star formation. Two different experimental configurations, representing different astrophysical situations, are studied. The first is a test case in which a single BW interacts with the obstacle. This is a common system in the Universe. The second, which uses two BWs, explores a less common situation. In the early Universe, large molecular clouds, with masses and sizes up to 200 pc were present. Völschow et al.21 showed that in the second half of their lifetimes (typically a few Myr), more than 30 supernova explosions took place. Born in the same stellar nursery, the resulting remnants had approximately similar lifetimes. Before dilution, the typical size of one such SNR would have been around 20 pc. In the tens of thousands of years before dilution, these SNRs could then interact with each other inside the molecular cloud. This resulted in compression of the surrounding gas and the formation of new stars in the vicinity (in the clumpy part of the cloud); see Fig. 1. This also allowed efficient injection of material into the interior of the molecular cloud. This phenomenon is too complicated to study comprehensively from a numerical perspective. However, it is possible to study the microphysics associated with such phenomena in the laboratory. Nevertheless, the experiment also suffers from its own restrictions, which will be explained later on.
![]()
Figure 1.Illustration of the evolution of a massive molecular cloud, indicating the importance of SNR propagation in forming new stars.
A. Characteristic timescale
There are several parameters that it is important to evaluate in this context.16,22 The first is the density contrast χ between the cloud and the propagation medium. It takes the form
The radiative cooling time τcool determines the rate at which the plasma cools down. This parameter is important, since cooling is necessary to reduce the thermal energy and pressure24 and to compress the cloud efficiently without the need for gravitation. Expressions for τcool in the optically thick and thin cases can be found in Ref. 25. In an optically thin medium, it is necessary to introduce the radiative cooling function,26 the accurate evaluation of which can be complicated. Indeed, the medium is never perfectly thick (except in specific objects such as stellar interiors), which necessitates the use of the cooling function. Falize et al.27 have developed a more robust expression for the radiative cooling timescale τcool.
When τcool ≪ τcc, the cloud can be compressed strongly, forming a dense layer right behind the shock. If the characteristic lengthscale for heat conduction is smaller than the characteristic radiative cooling length (the region where radiative cooling is dominant), then the dense layer is formed without any effects of heat conduction. In our case, τcool is of the order of τcc. This means that radiative cooling is not the dominant mechanism reducing thermal energy and pressure.
B. Characteristic blast wave velocity conditions
Previous studies have shown that specific BW velocity conditions must be achieved to simultaneously trigger the collapse of the cloud/dense clump and initiate mixing between the cloud/dense clump material and the BW.8,11 On the one hand, if the BW is too fast, efficient mixing of its material with the shocked cloud material will not occur. On the other hand, if the BW is too slow, the shock transmitted into the cloud will be too weak to initiate gravitational collapse of the latter. Boss et al.8 showed that for a molecular cloud of 1 M⊙, it is necessary to have an initial BW velocity of at least 20 km/s to have the two effects described above combined. For a stellar mass of ∼2 M⊙, an efficient velocity between ∼5 and ∼70 km/s will generate collapse.11 Another numerical study28 obtained destruction of a small cloud for BW velocities above 50 km/s. However, it seems that the clump is not strongly affected for BW velocities below 30 km/s. According to simple scaling laws developed by Ryutov et al.,25 it is possible to evaluate the experimental instantaneous velocity on collision with the foam that is required for the investigation of the following different situations: (i) the dense clump is not affected by the shock, (ii) the dense clump is fully compressed into a single core, and (iii) the dense clump fragments into smaller dense pieces. Let us take the astrophysical case illustrated in Fig. 1. A dense clump is located ∼2 pc from the sources of the BWs, which propagate in a dense medium (compared with the ISM, which is typically 10–100 times lower in density). The collision of SNRs with the dense clump occurs on a timescale of ∼2 × 10⁴ years. This case can be investigated in the laboratory by setting a distance between the foam and the BW source of ∼7 mm and an interaction time of ∼100–150 ns. The resulting factor in this configuration is vlab ∼ 0.6vastro. In this case, the 50 km/s limit obtained by Dhanoa et al.28 for dense clump destruction translates to 30 km/s in the laboratory. On the other hand, for astrophysical velocities below 30 km/s, the dense clump is not strongly affected. This translates, in the laboratory, to 18 km/s. It is then important to confirm these results in restricting our experiment to BW velocities of 20–30 km/s. It is interesting to note that this scaling can also be applied to other astrophysical situations, for example the DEM L316 SNRs in the Large Magellanic Cloud.29 There, shell A has a shock velocity of the order of ∼220 km/s, at 15 pc from the explosion and 2.7 × 10⁴ years. The corresponding experimental velocity should be ∼25 km/s. The parameters of shell B are slightly different (a shock velocity of ∼220 km/s, at 22 pc and 3.6 × 10⁴ years) which leads to an experimental shock velocity of ∼21 km/s, with the same geometry as explained above. As a final remark, we note that to change the experimental instantaneous velocity to comply with scaling laws, one can vary the laser energy while keeping the same experimental geometry.
III. EXPERIMENTAL SETUP
The experiment was performed at the LULI2000 laser facility at the LULI Laboratory (Ecole Polytechnique, France). The experimental setup has been described in detail in Ref. 20. Here, the experimental chamber was filled with N2 gas at 11.4 mbar. One or two long-pulse laser beams (τ ∼ 1 ns, with E0 ∼ 500 J per beam, at a wavelength λL = 527 nm and with a 200 µm focal spot) irradiated one or two 300 µm diameter carbon rods to produce one or two BWs. The short spatial and timescales of the energy deposition from the laser onto the rod produced an explosion that generated a nearly spherical BW propagating through the background gas. In this configuration (in contrast to Ref. 20), for most of the shots, the distance between the two carbon rods was set to 1 cm to have a sufficiently large mass swept up by the BW, while at the same time keeping a velocity at impact of the order of 20 km/s. Several diagnostics were implemented:20 (i) a 2D schlieren imaging system to obtain the evolution of the BW radius from the electron density gradient ∇ne for ne < 1 × 1020 cm−3, (ii) a 2D Mach–Zehnder interferometer giving a map of the electron density of the BW in the range ∼5 × 10¹⁷–1 × 1020 cm−3 through Abel inversion,30 (iii) time-resolved optical spectroscopy in the range ∼450–800 nm to get the density and temperature of the probed region with the help of the PrismSPECT code.31 We also employed dedicated x-ray radiography (see Fig. 2) to track the shock wave propagating inside the foam ball and evaluate its density. The x-ray source was generated by irradiating a 25 µm diameter Ti wire with a laser beam of energy 10 J, at the fundamental wavelength of 1.053 µm, with a 500 ps pulse duration, focused down to ∼20 µm. It was located 2 cm from the center of the foam, while the x-ray CCD was 26 cm from the foam center, leading to a geometric magnification of 13 (see Fig. 2). The objective was to have a quasi-monochromatic x-ray source as the main emission coming from the He α lines of Ti at 4.7 keV to determine the mass density. The x-ray spectrum on each shot was measured using an x-ray spectrometer. To block the lower x-ray contribution coming from the corona and to have a quasi-monochromatic x-ray radiography, we added filters to the detector (a large-area x-ray CCD): 50 µm of polyethylene, 11.4 µm of Ti, and 10 µm of V, acting as a Ross filter pair. The relatively long pulse used for the x-ray source (500 ps) could have led to a blurring of the x-ray radiograph. However, under these conditions, the shock velocity inside the foam would have been ∼0.2 km/s, leading to negligible blurring compared with the x-ray source size. The spatial resolution was of the order of the source size, ∼25 µm. This resolution did not allow us to visualize the shock wave, but we were able to evaluate its overall compression.
![]()
Figure 2.Experimental setup for N2 at 11.4 mbar. Not to scale.
A. Experimental considerations
To reproduce part of a molecular cloud, a spherical CH foam, made by General Atomics, was used. Its density was 150 mg/cm3 and its diameter ∼950 µm. This foam ball was located ∼7 mm from each carbon rod (see Fig. 2). The density contrast defined in Eq. (1) is then of the order of χ ∼ 104. This means that we are simulating a small dense clump. According to Eq. (2), and taking an instantaneous BW velocity at impact with the foam of ∼20 km/s, we obtain vc,sh = 0.2 km/s. We can also evaluate the characteristic timescale during which the experiment should be applicable to the astrophysical situation: τcc = 2375 ns. The pressure variation timescale is also evaluated to be τp ∼ 30 ns. As a consequence, in our experiment, the foam ball should experience a strong pressure difference between its sides owing to the fact that the pressure acting on the foam is not homogeneous on the size of the foam. Finally, the cooling timescale will be larger than τp, which implies that we should not observe a strong compression into a dense layer right behind the shock. The experimental parameters are summarized in Table I.
| Parameter | Symbol | LULI experiment | Astrophysical system | |
|---|---|---|---|---|
| Propagation medium | Nature of gas | N2 | ||
| Initial density | ρi,i | 1.34 × 10⁻⁵ g/cm3 | 0.1–105 cm−3 | |
| Density ratio | χ | ∼1 × 10⁴ | 10–105 | |
| Blast wave | Shock velocity at impact | vb,sh | 21 km/s | 10–3000 km/s |
| Shock front density at impact | ρb,i | 5 × 10⁻⁵ g/cm3 | ||
| Mach number | M | 1–10 | 1–100 | |
| Postshock intercloud temperature | Tb,sh | ∼4–5 eV | 1 up to ∼2000 eV | |
| Cloud | Cloud radius | Rc | 475 µm | 0.01–200 pc |
| Preshock cloud density | ρc,i | (60–500) × 10−3 g/cm3 | 1–500 cm−3 | |
| Shock cloud velocity | vc,sh | 0.2 km/s | 0.03–1000 km/s | |
| Characteristic timescales | Cloud crushing timescale | τcc | 2375 ns | 1 × 10⁴–1 × 10⁵ yr |
| Pressure variation timescale | τp | 30 ns | 1 × 10³–1 × 10⁴ yr | |
| Cooling timescale | τcool | ≥1000 ns | 100–1000 yr | |
| Comparison of characteristic timescales | τcc vs τcool | τcc ≥ τcool | τcc ≫ τcool (radiative) | |
| τcc vs τp | τcc ≫ τp | τcc ≪ τp |
Table 1. Summary of experimental and astrophysical parameters. Astrophysical data for the SNRs are taken from Ref.
B. Restrictions of the experiment
Several restrictions concerning the ability of our experiment to reproduce the astrophysical situation shown in Fig. 1 should be addressed before going further. In the laboratory, the self-gravitation of the foam is negligible, implying that the experiment is only relevant in the early stage of the interaction between the BW and the foam, i.e., when gravitational forces are negligible compared with other thermal, radiative, magnetic, and rotational forces. This corresponds to some fraction up to one τcc ∼ 2375 ns. Another important point is to obtain a quasi-monochromatic x-ray radiography to minimize the uncertainties when evaluating the mass density. This is why Ross filters were added to our x-ray CCD to maximize the monochromaticity of the x-ray beam.
IV. INTERACTION OF A SINGLE BLAST WAVE WITH THE FOAM BALL
In this section, the interaction between a single BW and the foam ball is described. Figure 3 shows the schlieren data and associated interferogram, allowing us to determine the experimental instantaneous velocity and density of the BW.
![]()
Figure 3.Experimental results in N2 at 11.4 mbar. (a) Expansion of a single BW, taken 100 ns after the main pulse, toward the obstacle located 7.07 mm from the carbon rod. (b) Expansion of a single BW, taken at 450 ns, toward the obstacle located 11 mm from the carbon rod. (c) Zoom of (b) showing the deviation of the morphology of the BW from spherical to nonspherical when interacting with the foam ball. (d) Interferogram corresponding to (a). (e) Simulated interferogram. (f) Electron density profile corresponding to (f). (g) Experimental BW radius
A. Velocity
The first important parameter that needs to be determined accurately is the BW velocity at the beginning of the impact with the foam ball. This is a constraint that can be used to model the system using numerical simulations (e.g., FLASH). Figure 3(g) presents measurements of the radius of the BW as a function of time. We observe that our data confirm that the BW is in a spherical Taylor–Sedov phase following a t2/5 dependence. From these measurements, we can deduce the instantaneous shock velocity [Fig. 3(h)]. At 5 mm from the source (corresponding to the location of the impact of the two BWs when the distance between the two carbon rods is set to 1 cm), the BW velocity is of the order of 36.6 ± 0.7 km/s. At the impact with the obstacle, when the distance is set to 7.07 mm, it decreases to vi,sh ∼ 21.7 ± 0.4 km/s. At 11 mm [see Figs. 3(b) and 3(c)], it is of the order of 10 ± 0.2 km/s.
B. Density and temperature
In our previous work,20 the density as well as the temperature were determined precisely using time-resolved optical spectroscopy coupled to PrismSPECT simulations.31 However, the interferometry diagnostic did not allow us to get an accurate measurement of the electron plasma density, mainly owing to the fact that the symmetry conditions needed to perform Abel inversion were not fulfilled. Here, we have adopted a different approach using the interferogram data. First, we generated a simulated electron density map [see Fig. 3(f)] and used it to produce a simulated interferogram [Fig. 3(e)] that we directly compare with the experimental one [see Fig. 3(d)]. Different analytical electron density solutions have been used to build the electron density map. We used Gaussian and Lorentzian functions and varied the different free parameters of these functions to get the best qualitative agreement with the experimental data. We next removed the nonphysical solution (e.g., a compression ratio of 2 is not what is expected when looking at the schlieren data). In that way, a Lorentzian function seems to better reproduce the data with a maximum electron density of ∼2 × 1019 cm−3. This is in agreement with a previous analysis20 made using interferometry. However, this determination suffers from drawbacks, since the maximum electron density using a Lorentzian function has little effect on the phase shift, owing to the small spatial extent of such a high-density region. To get a better idea of the electron density in the shock front, it will be necessary to increase the spatial resolution of the diagnostic. However, an average electron density of ∼(1–2) × 1019 cm−3 seems to be reasonable and in agreement with previous estimates obtained using time-resolved optical spectroscopy.20 The temperature was determined using PrismSPECT simulations and is of the order of T ∼ 4.5 ± 0.4 eV at the beginning of the impact (see Fig. 4), before decreasing slowly to T ∼ 4 ± 0.4 eV at t = 300 ns. The average ionization Z* is approximately equal to 2 in this configuration. These results are given at the location of the time-resolved optical spectroscopy diagnostic, located ∼6.1 mm from the carbon rod (and 1.5 mm from the edge of the foam in the middle of the two carbon rods; see Fig. 2).
![]()
Figure 4.Comparison between PrismSPECT simulations and experimental data averaged between 138 and 162 ns, corresponding to the time of impact with the obstacle. The simulations were performed with an initial mass density
C. Compression of the foam
Figure 5 presents x-ray radiographs of the unshocked foam t = 500 ns after the main laser pulse. At such long times, the front of the BW is already far away from the foam ball. One can observe in Fig. 5(b) the presence of a small contraction of the foam in the direction of the BW. The density can be retrieved from x-ray radiographs using the Beer–Lambert law (for more details, see Ref. 33),
![]()
Figure 5.X-ray radiographs of the 150 mg/cm3 foam ball: (a) without the influence of a BW, for reference; (b) at
D. Discussion
The evaluation of the mass density contains two possible sources of error. The first is due to the non-monochromaticity of the x-ray beam. This can significantly change the absorption coefficient μ in Eq. (6), leading to large uncertainties. In the experiment presented here, we attempted to nullify this effect by obtaining the most monoenergetic x-ray beam possible using a dedicated source and Ross filters, and hence this should not be the dominant uncertainty. The second problem is linked to the ratio I(d)/I0. As the foam is a sphere, the x-ray absorption is extremely low at the edge, which give rise to uncertainties. However, useful information can be still retrieved from x-ray radiographs. The deformation velocity can be evaluated at t = 500 ns, assuming that the BW begins to interact with the balloon at ∼120 ns [see Fig. 3(a)], leading to a shock velocity inside the foam of 0.15–0.3 km/s. This is especially interesting, because it corresponds more or less to vc,sh in Eq. (2). As a consequence, it is a good sign of the launching of a compression wave inside the foam. The foam ball also experiences a strong pressure difference between its sides owing to the fact that τp ≪ τcc, as expected. This is highlighted in Fig. 5 by the fact that the edge of the foam facing the BW (represented by the green arrow) is strongly modified compared with the opposite edge of the foam, which remains unaffected.
On the other side, the morphology of the BW deviates from spherical to nonspherical when passing through the obstacle [see Figs. 3(b) and 3(c)]. This is interesting from an astrophysical perspective, because astronomical observations of the Cygnus Loop and of Tycho’s SNR6 show a clear deformation of the shell of the SNR at positions of cloud interactions. This provides us information on the density and distribution of matter in the cloud, since there is an energy-dependent absorption. If the dense clump, illustrated in Fig. 1 is perfectly spherical (like our obstacle in the experiment), the BW will follow the curvature of the obstacle [as can be seen in Fig. 3(c)], whereas if the cloud is highly inhomogeneous in density, the shell of the BW will be perturbed accordingly. This could, in principle, lead to the generation of magnetic fields through the Biermann battery effect, and could thus be a favorable environment for particle acceleration.
V. INTERACTION OF TWO BLAST WAVES WITH THE FOAM BALL
This section focuses on the interaction of two BWs with the foam ball [see Fig. 6(a)]. The astrophysical analogy is illustrated schematically in Fig. 1.
![]()
Figure 6.(a) Schlieren data showing the expansion of both BWs toward the obstacle
A. Velocity, density, and temperature
In this geometry, both BWs have a velocity of ∼36 km/s when they begin to interact together, and of the order of 20 km/s when impacting the foam ball. As can be seen in Fig. 6(a), both BWs begin to interact with the foam before the interaction zone formed by the impact of the BWs reaches the foam, owing to the finite size of the foam (1 mm in diameter). We expect to have a higher compression of the foam in this case, owing to the higher density (by a factor of 1.75) and temperature (18%–20% hotter) of the interaction zone as compared with the case of a single BW.20
B. Compression of the foam ball
Figure 6 presents x-ray radiographs of the foam at different times during the interaction. One can clearly see a strong difference in pressure between the sides of the foam, as expected. Moreover, the side where the BWs interact is clearly compressed compared with the reference foam [Fig. 6(b)]. There is also a strong difference compared with the single-BW case [see Fig. 5(b)]. From these data, one can evaluate (i) the shock wave velocity transmitted inside the foam and (ii) the mass density using the procedure described in Eq. (6). However, the same uncertainties as above apply here too. For example, in Fig. 6(e), there is a large amount of noise on the left edge of the foam, which gives rise to unacceptably large uncertainties in the mass density of the foam (this likely comes from x-ray emission directly from the laser–target interaction, which was incompletely blocked). Moreover Eq. (6) involves the opacity μ, which can be approximated using the cold opacity of CH. One way to deal with it is to evaluate the deformation of the foam ball from x-ray radiographs. The boundary of the foam corresponds approximately to a boundary of strong density, i.e., cm−3.
This is what has been done in Fig. 7(a). Over time, the diameter of the ball becomes smaller. The initial deformation velocity is of the order of 0.41 ± 0.1 km/s between 300 and 500 ns, which is in agreement with the preliminary calculations in Sec. III A. The deformation velocity decreases slightly from 0.34 ± 0.1 to ≤0.1 km/s after 1000 ns. However, this does not mean that a compression wave is launched in the foam, for example, it could be due to ablation. Figure 7(b) shows the results of the calculation of the mass density inside the foam using Eq. (6). The foam is clearly compressed. As noted above, uncertainties are still important here, and so the analysis of these data will be mainly qualitative. Nevertheless, the maximum mass density is of the order of 218 ± 150 mg/cm3. The structure of the shock is also not straightforward, since it is not planar, but converges toward the central axis of the foam. This can be seen from Fig. 6 on looking at the evolution of the depletion zone inside the full red circle that represents the original foam ball [see, e.g., Fig. 6(f)]. The edge of the foam, facing the BWs, is well defined at t = 1000 ns compared with the reference case, which results in a lower signal on the detector (darker). This implies that x-rays are more strongly absorbed owing to a higher density compared with the reference case. As a consequence, the foam has been compressed in the direction of the propagation of the BWs. One can, in principle, evaluate the shock velocity by using the mass density retrieved from the data and Eq. (6). Here, we should point out that the uncertainties are significant in the evaluation of the mass density, but not in that of the position of the maximum density [see Fig. 7(b)] along its diameter. Therefore, it is possible to give an average shock velocity by considering the position of the maximum mass density. As a consequence, the shock propagates inside the foam with an averaged velocity between 500 and 1000 ns of 0.08 km/s, decreasing to 0.05 km/s between 1000 and 1500 ns. These results are only qualitative, and only the order of magnitude of the shock velocity should be taken into account.
![]()
Figure 7.(a) Deformation of the foam. The inset shows the different ways measurements were performed. (b) Mass density retrieved from the data shown in
C. Astrophysical discussion
Even if, in the laboratory, self-gravitation is negligible, our experiment can still be relevant to the astrophysical perspective, specifically the Jeans mass. This concept is used to evaluate when a stable medium that is homogeneous in density (i.e., in hydrostatic equilibrium) becomes unstable due to a small perturbation (generated, for example, by its interaction with SNRs). The Jeans mass is more relevant than the Ebert–Bonnor sphere here, in the initial stage of the interaction, since the foam is assumed to be homogeneous in density. This is, however, not the case after the interaction, since some of the matter is then ablated and some compressed. Here the Ebert–Bonnor sphere might be more relevant. The difference between the two models gives rise to only a small difference (a factor of 2, more or less), and we will not consider it here. Assuming that the total Ebert–Bonnor mass (and also the Jeans mass) is proportional to T3/2ρ−1/2, where T is the temperature and ρ the local mass density, one can see that when the density is increases, the Ebert–Bonnor mass decreases (assuming that the temperature does not evolve too much on these timescales). In other words, the densification of the clump induced by its interaction with SNRs can lower the threshold to trigger gravitational instability. This is not an obvious message, because the interaction of the SNRs with a dense clump could also lead to ablation of the latter, and so to a lowering of the average density and a higher Ebert–Bonnor mass. To have a relevant message for the astrophysical community, one should try, in the experiment, to evaluate if there is a densification of the foam after the passing of BWs. This can be evaluated by combining optical (interferometry, schlieren, or optical spectroscopy) and x-ray diagnostics, as has been done in this paper. However, it is more relevant to use a lower x-ray photon energy, compared with what we used here, to probe the mass density of the foam and thereby provide access to the whole range of density (from 1017 cm−3 up to solid density). We have not performed such a study here, principally because the x-ray photon energy was too high. As a consequence, there is a missing density gap between x-rays and optical diagnostics that could lead to a misunderstanding or wrong interpretation of our data.
VI. CONCLUSION AND PERSPECTIVES
In conclusion, in this paper, we have presented a new platform to study the collapse of a molecular cloud through its interaction with an external agent (here SNRs) from an experimental point of view. Using a single BW, we observed a weak compression of the foam, whereas, when we used two BWs, the compression was ∼30% higher. This phenomenon is therefore particularly important in the early Universe to trigger the collapse of dense clumps to form new stars at a higher rate. A quantitative analysis is beyond the scope of this paper and will be provided in a future companion paper. To summarize, the results of our investigations are as follows: (i) a deformation of the shell of the BW due to its interaction with the foam has been observed; and (ii) a compression of the foam has been detected, which evolves during time.
Nevertheless, some issues arise, due mainly to the x-ray source used to radiograph the foam. The first of these is the signal-to-noise ratio of the x-ray radiographs. Indeed, for accurate evaluation of the mass density, a high contrast is necessary [which can be seen as the ratio I(d)/I0 in Eq. (6)]. The second is the need to have a quasi-monochromatic beam to determine the mass density. In practice, laser-generated x-ray source beams can never exactly fulfill this requirement, even though the monochromaticity can be improved using Ross filters, for example. An x-ray free-electron laser source could, however, potentially solve these problems. A huge improvement would be to use an imaging crystal34 to ensure a monochromatic x-ray source.
The mixing between the material of the SNRs and that of the molecular cloud could also be studied experimentally by using specific diagnostics (such as time-resolved optical spectroscopy) to track the emergence of new lines and evaluate fundamental parameters for astrophysical perspective such as mixing efficiency and time. In addition, the impact of an external magnetic field could in principle be studied in laser-produced plasma experiments35 to evaluate its influence on the compression of molecular clouds, which is a topic of much current astrophysical interest (see preliminary work by Gregori et al.36). Indeed, a modification of the BW propagation due to an external magnetic field has already been observed,37 which could give rise to strong modification of the compression as the shock wave becomes continuous and as the morphology of the BW shell itself changes.
ACKNOWLEDGMENTS
Acknowledgment. The authors would like to thank the LULI staff for their contribution. This work has been done with the support of Investissements d’Avenir of LabEx PALM (Grant No. ANR-10-LABX-0039-PALM). The research was also supported by the Ministry of Science and Higher Education of the Russian Federation (Agreement with Joint Institute for High Temperatures RAS No. 075-15-2020-785). G.G. acknowledges support from the UK EPSRC (Grant Nos. EP/M022331/1 and EP/N014472/1). N.O. is grateful for support under the International Joint Research Promotion Program by Osaka University. We would also like to thank M. Manuel and General Atomics for providing the foam balls.
References
[1] D. D.Ryutov, R. P.Drake, B. A.Remington. Experimental astrophysics with high power lasers and
[2] G. P.Garmire, E. D.Feigelson, K. V.Getman, M. A.Kuhn, A.Sicilia-Aguilar, P. S.Broos. The Elephant Trunk Nebula and the Trumpler 37 cluster: Contribution of triggered star formation to the total population of an HII region. Mon. Not. R. Astron. Soc., 426, 2917(2012).
[3] E. C.Ostriker, C. F.McKee. Theory of star formation. Annu. Rev. Astron. Astrophys., 45, 565(2007).
[4] S.Lizano, F. C.Adams, F. H.Shu. Star formation in molecular clouds: Observation and theory. Annu. Rev. Astron. Astrophys., 25, 23(1987).
[5] M. R.Krumholz. Star formation in molecular clouds. AIP Conf. Proc., 1386, 9(2011).
[6] G.Dubner, D. C.Ellison, D.Castro, P.Slane, A.Bykov. Supernova remnants interacting with molecular clouds: X-ray and gamma-ray signatures. Space Sci. Rev., 188, 187(2015).
[7] S.Li, A.Frank, E. G.Blackman. Triggered star formation and its consequences. Mon. Not. R. Astron. Soc., 444, 2884(2014).
[8] E. A.Myhill, H. A. T.Vanhala, S. A.Keiser, S. I.Ipatov, A. P.Boss. Simultaneous triggered collapse of the presolar dense cloud core and injection of short-lived radioisotopes by a supernova shock wave. Astrophys. J., 686, L119(2008).
[9] J.Castor, R.McCray, R.Weaver. Interstellar bubbles. Astrophys. J., 200, L107(1975).
[10] R.Weaver, R.McCray, R.Moore, P.Shapiro, J.Castor. Interstellar bubbles. II. Structure and evolution. Astrophys. J., 218, 377(1977).
[11] S. A.Keiser, A. P.Boss. Who pulled the trigger: A supernova or an asymptotic giant branch star. Astrophys. J., 717, L1(2010).
[12] E.Scannapieco, F. X.Timmes, L.Pan, S. J.Desch. Mixing of clumpy supernova ejecta into molecular clouds. Astrophys. J., 756, 102(2012).
[13] S. A.Keiser, A. P.Boss. Triggering collapse of the presolar dense cloud core and injecting short-lived radioisotopes with a shock wave. II. Varied shock wave and cloud core parameters. Astrophys. J., 770, 51(2013).
[14] P. R.Woodward. Shock-driven implosion of interstellar gas clouds and star formation. Astrophys. J., 207, 484(1976).
[15] J.Nittmann, S. A. E. G.Falle, P. H.Gaskell. The dynamical destruction of shocked gas clouds. Mon. Not. R. Astron. Soc., 201, 833(1982).
[16] P.Colella, R. I.Klein, C. F.McKee. On the hydrodynamic interaction of shock waves with interstellar clouds. I. Nonradiative shocks in small clouds. Astrophys. J., 420, 213(1994).
[17] G.Gregori, T. W.Jones, D.Ryu, F.Miniati. Three-dimensional magnetohydrodynamic numerical simulations of cloud-wind interactions. Astrophys. J., 543, 775(2000).
[18] A. M.Zhang, X. Y.Can, Z. F.Meng, B.Wang. Study on the pressure characteristics of shock wave propagating across multilayer structures during underwater explosion. Shock Vib., 2019, 9026214.
[19] J. M.Martinez Val, S.Eliezer. The comeback of shock waves in inertial fusion energy. Laser Part. Beams, 29, 175(2011).
[20] L.Van Box Som, S.Pikuz, S.Ryazantsev, E.Falize, P.Mabey, J.-R.Marquès, N.Ozaki, G.Rigon, J.Meinecke, T.Michel, M.Koenig, G.Gregori, B.Albertazzi, A.Ciardi. Experimental characterization of the interaction zone between counter-propagating Taylor Sedov blast waves. Phys. Plasmas, 27, 022111(2020).
[21] M.V?lschow, R.Banerjee, B.K?rtgen. Star formation in evolving molecular clouds. Astron. Astrophys., 605, A97(2017).
[22] E. P. G.Johansson, U.Ziegler. Radiative interaction of shocks with small interstellar clouds as a pre-stage to star formation. Astrophys. J., 766, 45(2013).
[23] C. F.McKee, D. J.Hollenbach, G. C.Seab, A. G. G. M.Tielens. The structure of time-dependent interstellar shocks and grain destruction in the interstellar medium. Astrophys. J., 318, 674(1987).
[24] K.Yirak, A.Frank, A. J.Cunningham. Self-convergence of radiatively cooling clumps in the interstellar medium. Astrophys. J., 722, 412(2010).
[25] J.Kane, B. A.Remington, R. P.Drake, D.Ryutov, W. M.Wood‐Vasey, E.Liang. Similarity criteria for the laboratory simulation of supernova hydrodynamics. Astrophys. J., 518, 821(1999).
[26] M. A.Dopita, R. S.Sutherland. Cooling functions for low-density astrophysical plasmas. Astrophys. J., 88, 253(1993).
[27] C.Michaut, é.Falize, S.Bouquet. Similarity properties and scaling laws of radiation hydrodynamic flows in laboratory astrophysics. Astrophys. J., 730, 96(2011).
[28] J.Mackey, J.Yates, H.Dhanoa. Pressure-driven fragmentation of multiphase clouds at high redshift. Mon. Not. R. Astron. Soc., 444, 2085(2014).
[29] Y. H.Chu, R. M.Williams. Supernova remnants in the magellanic clouds. VI. The DEM L316 supernova remnants. Astrophys. J., 635, 1077(2005).
[30] K.Bockasten. Transformation of observed radiances into radial distribution of the emission of a plasma. J. Opt. Soc. Am., 51, 943(1961).
[31] J. J.MacFarlane, P.Wang, I. E.Golovkin, N. A.Pereyra, P. R.Woodruff. SPECT3D—A multi-dimensional collisional-radiative code for generating diagnostic signatures based on hydrodynamics and PIC simulation output. High Energy Density Phys., 3, 181(2007).
[32] A. S.Hassani, B. T.Chiad, L. T.Ali. Determination of velocity and radius of supernova remnant after 1000 yrs of explosion. Int. J. Astron. Astrophys., 5, 125(2015).
[33] A.Dizière. Astrophysique de laboratoire avec les lasers de haute énergie et de haute puissance: Des chocs radiatifs aux jets d’étoiles jeunes(2012).
[34] Y.Aglitskiy, M.Rabec, N.Ozaki, A. Y.Faenov, B.Loupias, L. E.Gloahec, A.Benuzzi-Mounaix, M.Koenig, F.Perez, T. A.Pikuz. High efficient, easily spectrally tunable X-ray backlighting for the study of extreme matter states. Laser Part. Beams, 27, 601(2009).
[35] S.Simond, C.Riconda, H.Pépin, J.Fuchs, B.Albertazzi, S.Nitsche, J.Albrecht, S. N.Chen, D.Da Silva, E.Veuillot, J.Billette, T. E.Cowan, L.Romagnagni, B.Hirardin, M.Nakatsutsumi, S.Dittrich, T.Burris-Mog, J.Béard, O.Portugall, F.Kroll, T.Vinci, T.Herrmannsd?rfer, A.Ciardi, H.-P.Schlenvoigt. Production of large volume, strongly magnetized laser-produced plasmas by use of pulsed external magnetic fields. Rev. Sci. Instrum., 84, 043505(2013).
[36] G.Gregori, F.Miniati, D.Ryu, T. W.Jones. Enhanced cloud disruption by magnetic field interaction. Astrophys. J., 527, L113(1999).
[37] G.Rigon, J.-R.Marquès, B.Albertazzi, F.Kroll, F.-E.Brack, P.Perez-Martin, M.Koenig, U.Schramm, E.Falize, P.Mabey, C. A. J.Palmer, J.Topp-Mugglestone, G.Gregori, K.Falk, T. E.Cowan. Laboratory study of bilateral supernova remnants and continuous MHD shocks. Astrophys. J., 896, 167(2020).

Set citation alerts for the article
Please enter your email address
© Copyright 2018-2021 | Chinese Laser Press. All Rights Reserved 沪ICP备15018463号-20