
Meng Yang, Bao Zhang, Yulong Song. Application of Support Vector Machine Based on Optimized Kernel Function in People Detection[J]. Laser & Optoelectronics Progress, 2018, 55(4): 041001
- Laser & Optoelectronics Progress
- Vol. 55, Issue 4, 041001 (2018)
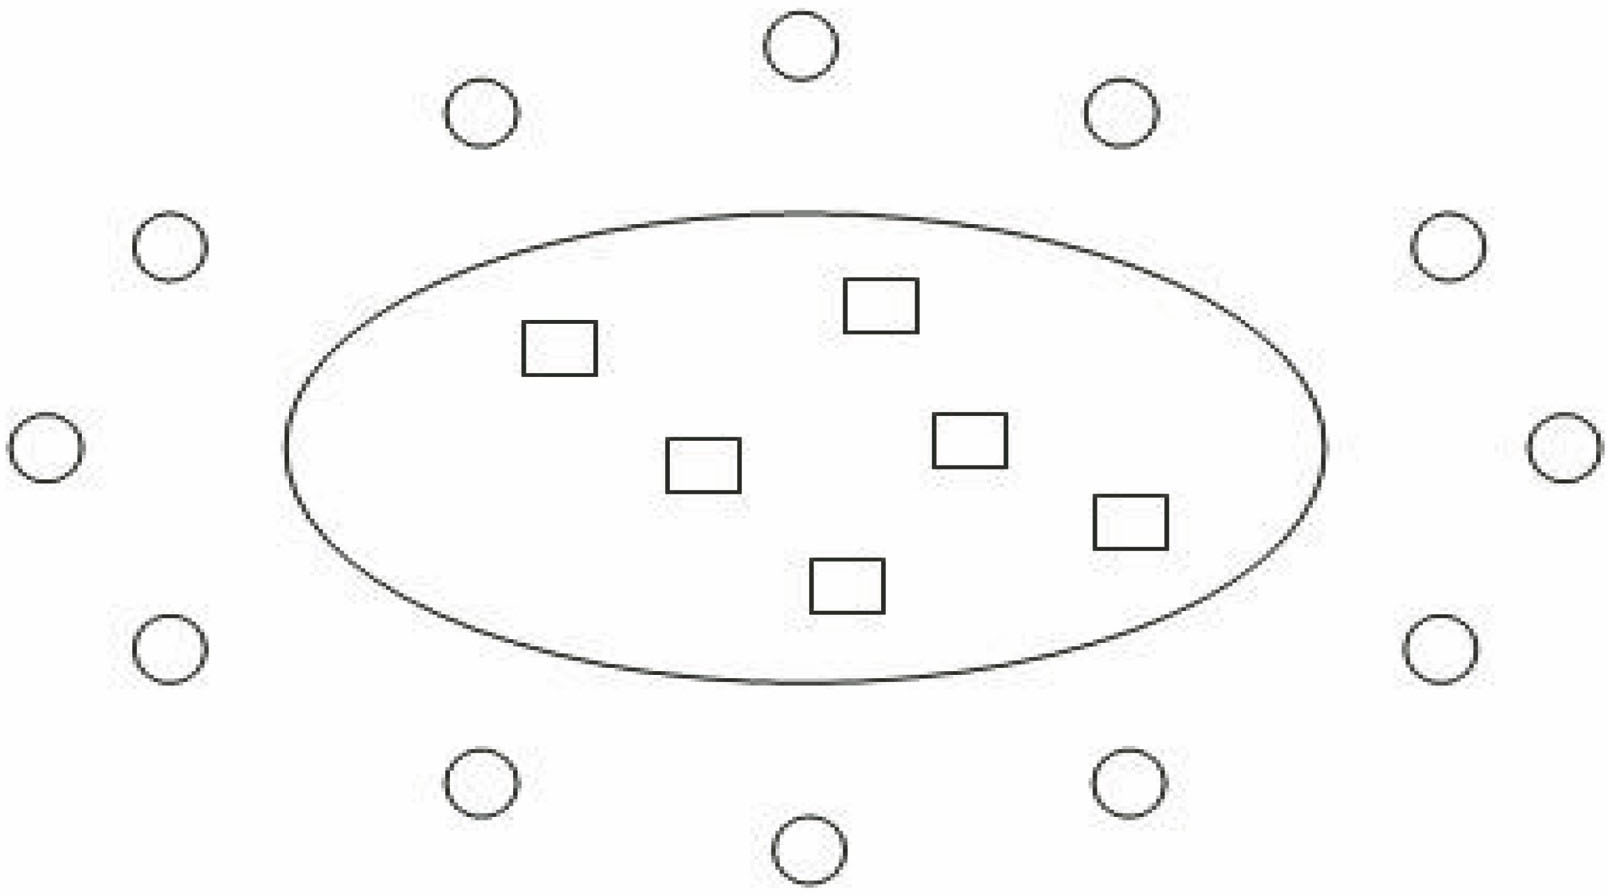
Fig. 1. Schematic of linear inseparable problem
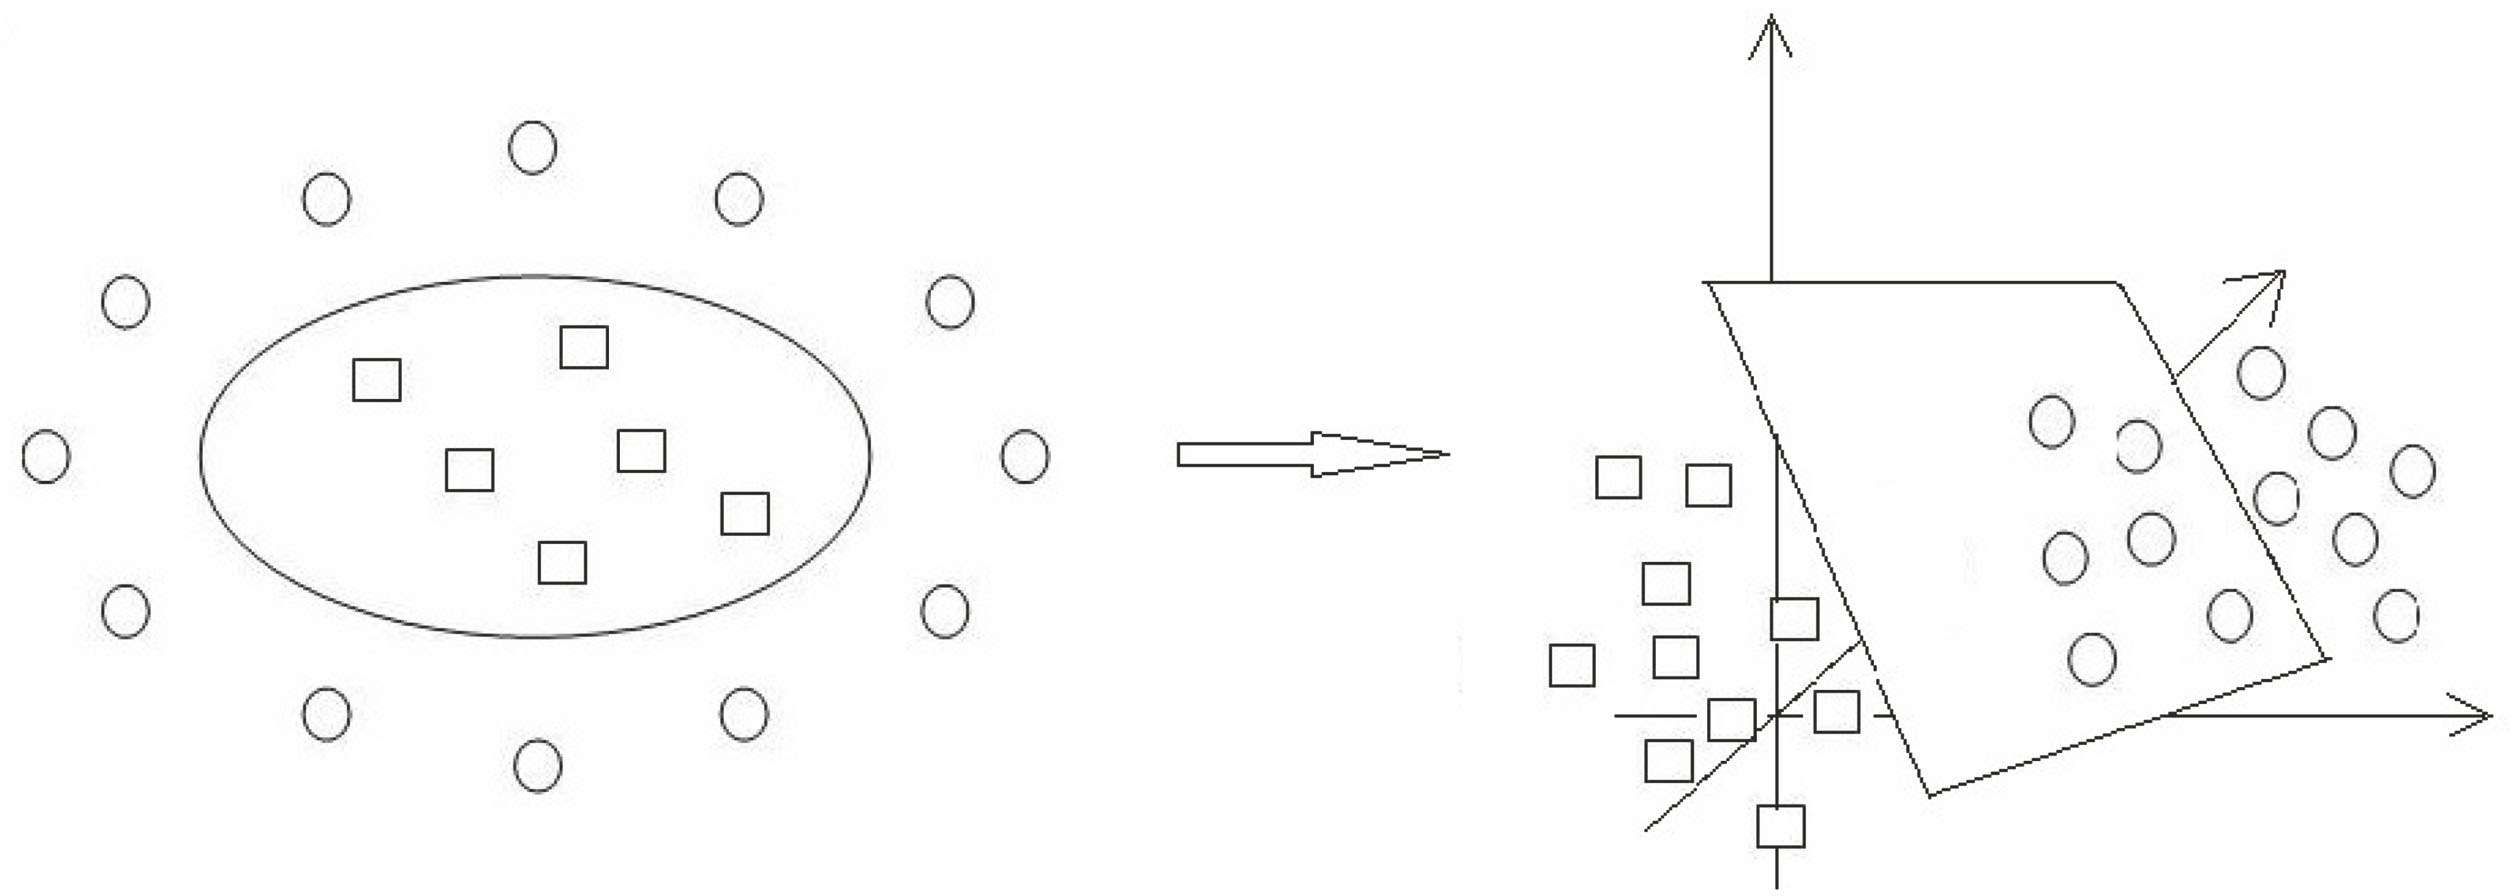
Fig. 2. Schematic of original space to high-dimensional feature space
Fig. 3. Schematic of near linear separable problem
Fig. 4. Feature extraction diagram. Results of (a) gray processing, (b) Gamma correction, and (c) gradient image
Fig. 5. Graph of kernel function. (a) Polynomial kernel function curve; (b) Gaussian kernel function curve
Fig. 6. Graph of combined kernel function
Fig. 7. Comparison of recognition rate
Fig. 8. Line chart of the change of recognition rate with C. (a) Polynomial kernel function; (b) Gaussian kernel function; (c) combined kernel function
Fig. 9. Comparison of the recognition rate between proposed algorithm and traditional algorithms
Fig. 10. Results of people detection
|
Table 1. Change of recognition rate with d
|
Table 2. Change of recognition rate with σ
|
Table 3. Change of recognition rate with α1

Set citation alerts for the article
Please enter your email address
© Copyright 2018-2021 | Chinese Laser Press. All Rights Reserved 沪ICP备15018463号-20