• Photonics Research
  • Vol. 9, Issue 7, 1358 (2021)
Zhong Zuo1、†, Chenglin Gu1、3、†,*, Daowang Peng1, Xing Zou1, Yuanfeng Di1, Lian Zhou1, Daping Luo1, Yang Liu1, and Wenxue Li1、2、4、*
Author Affiliations
  • 1State Key Laboratory of Precision Spectroscopy, East China Normal University, Shanghai 200062, China
  • 2Collaborative Innovation Center of Extreme Optics, Shanxi University, Taiyuan 030006, China
  • 3e-mail: clgu@lps.ecnu.edu.cn
  • 4e-mail: wxli@phy.ecnu.edu.cn
  • show less
    DOI: 10.1364/PRJ.422397 Cite this Article Set citation alerts
    Zhong Zuo, Chenglin Gu, Daowang Peng, Xing Zou, Yuanfeng Di, Lian Zhou, Daping Luo, Yang Liu, Wenxue Li. Broadband mid-infrared molecular spectroscopy based on passive coherent optical–optical modulated frequency combs[J]. Photonics Research, 2021, 9(7): 1358 Copy Citation Text show less
    Schematic of an individual mid-infrared OMFC. A mid-infrared CW ICL/QCL is combined with a near-infrared femtosecond laser, whose repetition rate frep is locked. Then they are injected into an optical parametric amplifier (OPA). Thus, the mid-infrared OMFC is formed after the OPA process. In the process, the CW signal is pulsed and amplified. The generated mid-infrared pulse sequence inherits the frequency fcw of the ICL/QCL, and its repetition rate is determined by the pump source in the optical frequency domain.
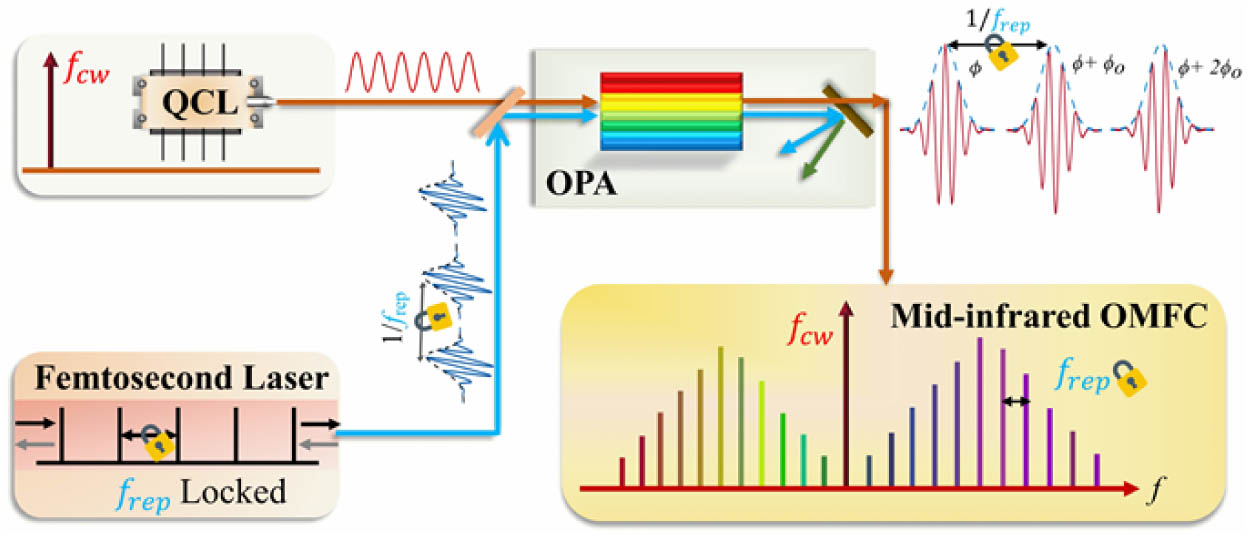
    Fig. 1. Schematic of an individual mid-infrared OMFC. A mid-infrared CW ICL/QCL is combined with a near-infrared femtosecond laser, whose repetition rate frep is locked. Then they are injected into an optical parametric amplifier (OPA). Thus, the mid-infrared OMFC is formed after the OPA process. In the process, the CW signal is pulsed and amplified. The generated mid-infrared pulse sequence inherits the frequency fcw of the ICL/QCL, and its repetition rate is determined by the pump source in the optical frequency domain.
    Mode-resolved DCS spectra. (a) Schematic of the DCS setup. Two OMFCs were combined and then passed through a multipass gas cell. After spectral filtering, the heterodyne signal was detected by a balanced HgCdTe detector retrieved to an optical domain. BS, beam splitter; G, mid-infrared grating. (b) Typical detector signal with multiple interferograms. (c) Retrieved DCS spectrum. One hundred spectra, each with a recording time of ∼1 s, were averaged. The top scale is the corresponding optical frequency. (d) Zoomed plot reveals mode-resolved gas absorption lines. The red curve is the gas absorption profile computed from the HITRAN database. (e) Individual comb teeth, centered at 30 MHz in the RF spectrum, show a prefect cardinal-sine shape with an FWHM of 1.4 Hz.
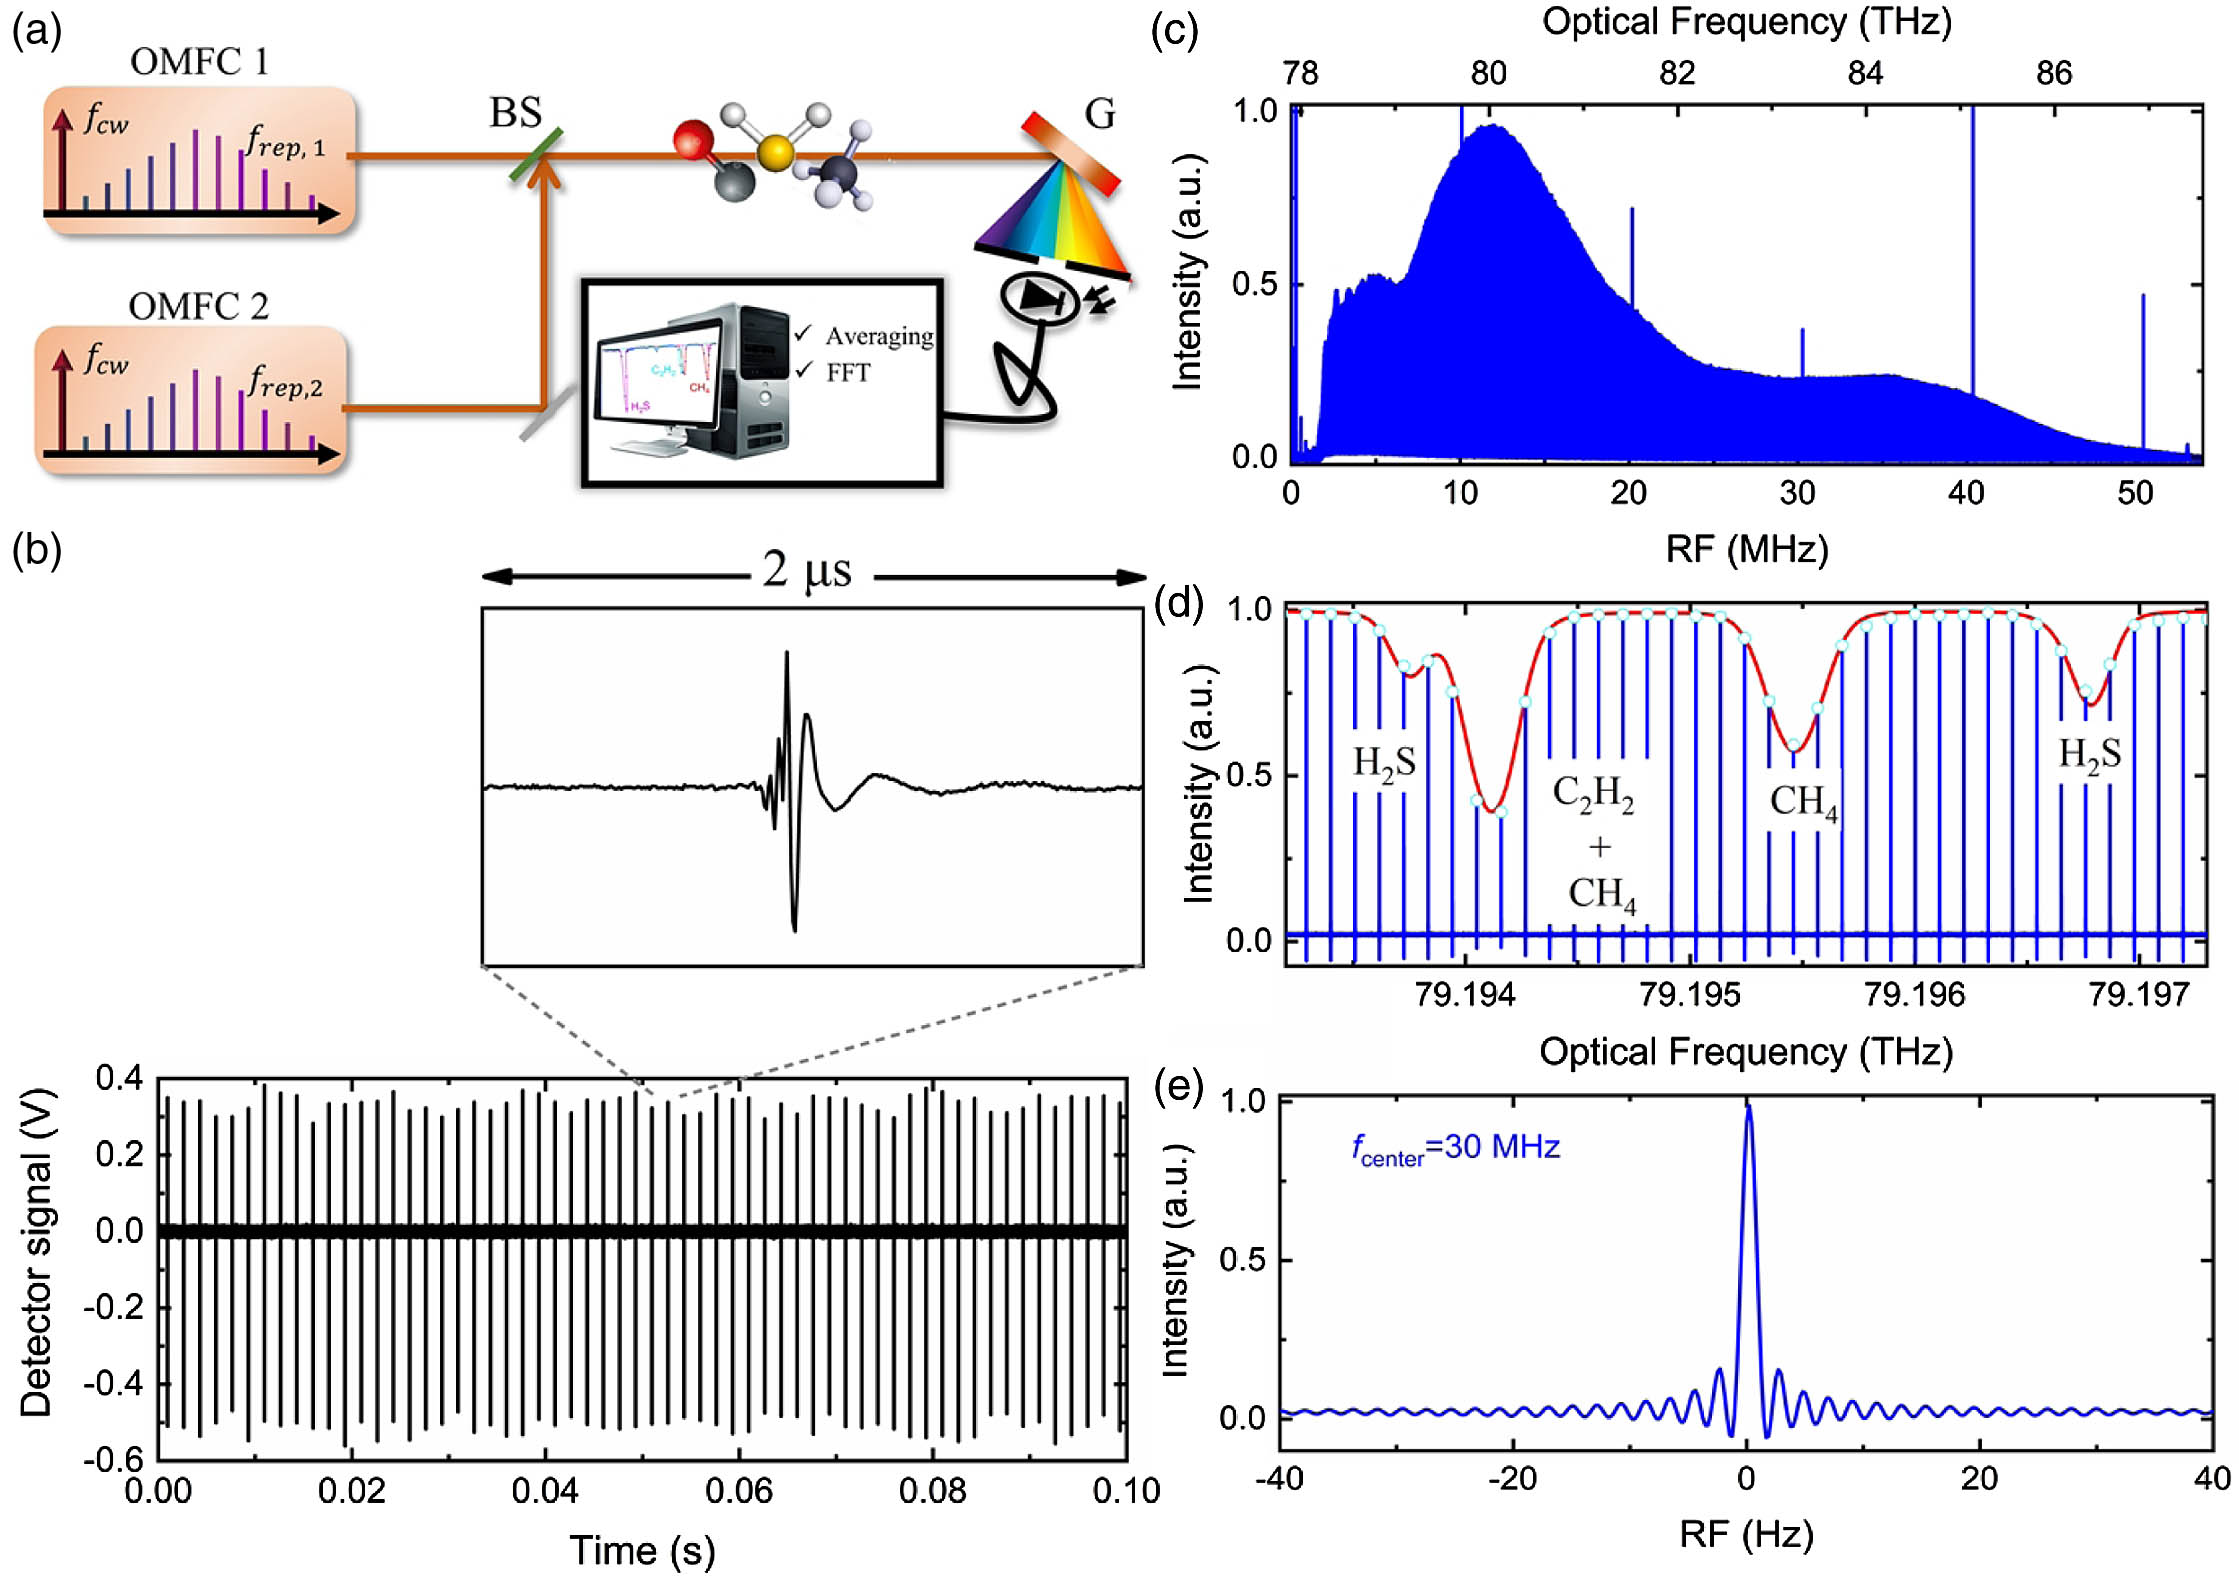
    Fig. 2. Mode-resolved DCS spectra. (a) Schematic of the DCS setup. Two OMFCs were combined and then passed through a multipass gas cell. After spectral filtering, the heterodyne signal was detected by a balanced HgCdTe detector retrieved to an optical domain. BS, beam splitter; G, mid-infrared grating. (b) Typical detector signal with multiple interferograms. (c) Retrieved DCS spectrum. One hundred spectra, each with a recording time of 1  s, were averaged. The top scale is the corresponding optical frequency. (d) Zoomed plot reveals mode-resolved gas absorption lines. The red curve is the gas absorption profile computed from the HITRAN database. (e) Individual comb teeth, centered at 30 MHz in the RF spectrum, show a prefect cardinal-sine shape with an FWHM of 1.4 Hz.
    DCS spectra of a mixture of gases. (a) Optical spectrum retrieved from a single interferogram coherently averaged 240,000 times. (b) Comparison results of the extracted gas absorption lines (blue line) and the theoretical profiles from the HITRAN database (light grey curve for H2O, magenta curve for H2S, violet curve for C2H2, and red curve for CH4). (c)–(f) Portions of the gas absorption lines of (b). The olive scatter represents the residual between the measured results and absorption profiles of these four gases from the HITRAN database.
    Fig. 3. DCS spectra of a mixture of gases. (a) Optical spectrum retrieved from a single interferogram coherently averaged 240,000 times. (b) Comparison results of the extracted gas absorption lines (blue line) and the theoretical profiles from the HITRAN database (light grey curve for H2O, magenta curve for H2S, violet curve for C2H2, and red curve for CH4). (c)–(f) Portions of the gas absorption lines of (b). The olive scatter represents the residual between the measured results and absorption profiles of these four gases from the HITRAN database.
    Tunable DCS spectra. (a) Measured spectra by scanning PPLN periods and adjusting the operating wavelength of the common CW laser. (b) Comparison between extracted gas absorption lines of (a) and the theoretical gas absorption profiles from the HITRAN database. The gaps are due to the electronical filter with a bandwidth of 2–48 MHz in the data acquisition processes. The weak spectral intensity and the low-frequency noises of the mid-infrared detector result in the deviations of the absorption intensity near the two gaps. (c) Portions of gas absorption lines of five gases.
    Fig. 4. Tunable DCS spectra. (a) Measured spectra by scanning PPLN periods and adjusting the operating wavelength of the common CW laser. (b) Comparison between extracted gas absorption lines of (a) and the theoretical gas absorption profiles from the HITRAN database. The gaps are due to the electronical filter with a bandwidth of 2–48 MHz in the data acquisition processes. The weak spectral intensity and the low-frequency noises of the mid-infrared detector result in the deviations of the absorption intensity near the two gaps. (c) Portions of gas absorption lines of five gases.
    DCS spectra of H2CO at a ppm-level concentration. (a) Retrieved DCS spectra of H2CO. (b) Comparison between the measured results and theoretical profile from the HITRAN database. The standard deviation of the residual is ∼0.32%.
    Fig. 5. DCS spectra of H2CO at a ppm-level concentration. (a) Retrieved DCS spectra of H2CO. (b) Comparison between the measured results and theoretical profile from the HITRAN database. The standard deviation of the residual is 0.32%.
    Line parameter measurements. (a) Portions of the gas absorption lines of the gas mixture of C2H2,CH4,H2S. Gaussian profiles (red curves) are used to fit the measured results (blue dots). The standard deviation of the residual between the measurement and its fit is calculated to be ∼0.7%, which includes the statistical and residual baseline noise. (b) Statistical distribution of 10 continuous measurements of the C12H4 P(10)F2(3) line center frequency. The error bar of each measurement is the standard error of the fitted line position parameter. The horizontal red line represents the average center frequency (80,355,670.1 MHz), which has been subtracted from each measured frequency for clarity.
    Fig. 6. Line parameter measurements. (a) Portions of the gas absorption lines of the gas mixture of C2H2,CH4,H2S. Gaussian profiles (red curves) are used to fit the measured results (blue dots). The standard deviation of the residual between the measurement and its fit is calculated to be 0.7%, which includes the statistical and residual baseline noise. (b) Statistical distribution of 10 continuous measurements of the C12H4P(10)F2(3) line center frequency. The error bar of each measurement is the standard error of the fitted line position parameter. The horizontal red line represents the average center frequency (80,355,670.1 MHz), which has been subtracted from each measured frequency for clarity.
    (a) Comparison of results with and without the adaptive sampling method at a measurement time of 10 s. A 30 cm optical path cell is filled with 10% CH4 in N2 buffer gas at 1 atm pressure. The standard clock indicates that the constant internal clock of data acquisition card served as the acquisition clock. (b), (c) Zoomed plots of (a) reveal the little difference between the two results. (d) Evolution of the average spectral SNR as a function of the measurement time without the adaptive sampling clock. The FPGA module triggered by the falling edge of the interferograms exported the data files at time intervals ∼1 s. Each file represents the averaged results of 600 interferograms. In the experiment, 3600 files, including 3600×600 interferograms, were obtained and then averaged. A power law fit with an exponent of 0.499(3) indicates that the SNR is proportional to the square root of the measurement time, which is expected for coherent averaging.
    Fig. 7. (a) Comparison of results with and without the adaptive sampling method at a measurement time of 10 s. A 30 cm optical path cell is filled with 10% CH4 in N2 buffer gas at 1 atm pressure. The standard clock indicates that the constant internal clock of data acquisition card served as the acquisition clock. (b), (c) Zoomed plots of (a) reveal the little difference between the two results. (d) Evolution of the average spectral SNR as a function of the measurement time without the adaptive sampling clock. The FPGA module triggered by the falling edge of the interferograms exported the data files at time intervals 1  s. Each file represents the averaged results of 600 interferograms. In the experiment, 3600 files, including 3600×600 interferograms, were obtained and then averaged. A power law fit with an exponent of 0.499(3) indicates that the SNR is proportional to the square root of the measurement time, which is expected for coherent averaging.
    Mode-resolved DCS spectra at different CW operating wavelengths. The red curves show the profiles computed from the HITRAN database using experimental parameters.
    Fig. 8. Mode-resolved DCS spectra at different CW operating wavelengths. The red curves show the profiles computed from the HITRAN database using experimental parameters.
    (a) Schematic of the spectral broadening of the OMFC. The generated near-infrared idler after the OPA process, which was first spectrally broadened, served as the signal in the next OPA process. Broadband mid-infrared pulses were obtained when a chirped PPLN crystal was used in the OPA process. HWP, half-wave plate; PBS, polarizing beam splitter; DM, dichroic mirror; PPLN, periodically poled lithium niobate crystal; LP, long-pass filter; HNLF, highly nonlinear fiber; D, delay line; APPLN, aperiodically poled lithium niobate crystal; Ge, AR-coated germanium window. (b) Measured mid-infrared spectrum after the cascade OPA processes.
    Fig. 9. (a) Schematic of the spectral broadening of the OMFC. The generated near-infrared idler after the OPA process, which was first spectrally broadened, served as the signal in the next OPA process. Broadband mid-infrared pulses were obtained when a chirped PPLN crystal was used in the OPA process. HWP, half-wave plate; PBS, polarizing beam splitter; DM, dichroic mirror; PPLN, periodically poled lithium niobate crystal; LP, long-pass filter; HNLF, highly nonlinear fiber; D, delay line; APPLN, aperiodically poled lithium niobate crystal; Ge, AR-coated germanium window. (b) Measured mid-infrared spectrum after the cascade OPA processes.
    Measured frequency stability of (a) near-infrared CW laser referenced to a fiber frequency comb, (b) mid-infrared CW ICL, and (c) QCL.
    Fig. 10. Measured frequency stability of (a) near-infrared CW laser referenced to a fiber frequency comb, (b) mid-infrared CW ICL, and (c) QCL.
    Zhong Zuo, Chenglin Gu, Daowang Peng, Xing Zou, Yuanfeng Di, Lian Zhou, Daping Luo, Yang Liu, Wenxue Li. Broadband mid-infrared molecular spectroscopy based on passive coherent optical–optical modulated frequency combs[J]. Photonics Research, 2021, 9(7): 1358
    Download Citation