
Zhong Zuo, Chenglin Gu, Daowang Peng, Xing Zou, Yuanfeng Di, Lian Zhou, Daping Luo, Yang Liu, Wenxue Li. Broadband mid-infrared molecular spectroscopy based on passive coherent optical–optical modulated frequency combs[J]. Photonics Research, 2021, 9(7): 1358
- Photonics Research
- Vol. 9, Issue 7, 1358 (2021)
Abstract
1. INTRODUCTION
Thanks to their unprecedented frequency accuracy and stability as low as [1], optical frequency combs (OFCs) have revolutionized optical frequency metrology by linking microwave and optical frequencies [2,3] and have provided new opportunities due to the evenly spaced hundreds of thousands of narrow-linewidth teeth as encountered in molecular spectroscopy [4–6], imaging [7,8], and biochemical research [9]. Several direct frequency comb spectrometers have been developed by combining a single OFC with various methods, such as interferometry [10,11], dispersive elements [12,13], and frequency filtering [14]. Dual-comb spectroscopy (DCS), using two coherent OFCs with slightly different repetition rates, integrates many strengths of conventional Fourier-transform spectroscopy and tunable laser spectroscopy into a single platform [15]. The spectral resolution and accuracy of DCS are only determined by the laser sources rather than the instruments. To date, DCS has innovated many other spectroscopy techniques such as time-resolved spectroscopy [16], coherent Raman spectroscopy [17,18], photoacoustic spectroscopy [19], cavity-enhanced spectroscopy [20,21], and two-photon spectroscopy [22,23]. However, DCS also doubles the challenges of the requirements to the frequency stability of two such OFCs, which can be solved by actively controlling the frequencies of both OFCs, i.e., the repetition frequencies and carrier-envelope offset frequencies, by use a self-reference scheme or a frequency reference to cavity-stabilized continuous-wave (CW) lasers with hertz-level linewidth [24]. The active control processes are generally achieved using phase-locked loops with fast intracavity actuators, such as the current modulation of the pump laser diode, acousto-optic modulators, and piezoelectric transducers [25,26]. Recently, Chen
Nowadays, the development of DCS aims at the extension of the wavelength region and the practical applications of DCS in field environments [5,30,31]. Among all the spectral domains, most molecules built the strong fundamental vibrational transitions in the mid-infrared region. However, limited by the gain media, mid-infrared sources are generated mainly based on nonlinear processes, such as difference frequency generation (DFG) sources [32], optical parametric oscillators [33,34], chip-scale microresonators [35], interband or quantum cascade lasers (ICLs or QCLs) [36,37], and supercontinuum broadened sources [38,39]. Many promising proof-of-principle experiments have demonstrated their intriguing potentials for the generation of mid-infrared DCS. The spectral elements involved in these schemes should be precisely controlled to obtain stabilized mid-infrared comb teeth, but often at the cost of complexity and the demand of a well-maintained laboratory environment. The current trend of achieving fieldable DCS is to design systems with built-in passive mutual coherence, which get rid of the control of a significant freedom, carrier-envelope phase (CEP). The intrapulse DFG or the DFG between two pulse trains sharing common near-infrared oscillators can directly generate mid-infrared DCS with zero-offset CEP [40,41]. Generally, the supercontinuum technique is often implemented to reach the required frequency range for the DFG process. Ycas
In this paper, we develop and demonstrate a broadband mid-infrared DCS based on its built-in passive mutual coherence. By the optical-optical modulation of a CW ICL or QCL, instead of using EOMs [45], the generated optical-optical modulated frequency combs (OMFCs) achieved the output spectral coverage over 400 nm in the mid-infrared domain, and the output power was synchronously amplified to 400 mW in the process. The robust mid-infrared sources have the potential for broadband spectroscopy in the lossy and fieldable environments. Besides, the spectral range of these sources can be tuned flexibly by replacing the operating wavelengths of mid-infrared CW lasers, even to the far-infrared region. The mutual coherence can be well maintained in the full spectral range. The measurements of multiple gas species, including , COS, and , were performed to verify the capability and sensitivity for broadband molecular spectroscopy in the experiment. Finally, the frequency accuracy of our mid-infrared DCS was also analyzed for long-term stable operation.
Sign up for Photonics Research TOC. Get the latest issue of Photonics Research delivered right to you!Sign up now
2. PRINCIPLE
Commercial ICLs or QCLs have achieved beam emissions from 2.5 to 24 μm. Mid-infrared OFCs based on multimode operating ICLs or QCLs are investigated to achieve a future integrated comb sensor [35,48]. The number of comb teeth is generally limited to several hundreds, which hinders its applications for broadband and high-resolution spectroscopy. Here we extend the concept of OMFC, proposed in our previous work on near-infrared OMFCs [47] to the mid-infrared region. As shown in Fig. 1, the mid-infrared CW laser is pulsed and amplified by a near-infrared femtosecond pump source in the optical parametric amplification (OPA) process. In the time domain, the CW-seeded OPA process can be explained as the optical–optical modulation process of a CW signal. The modulation frequency is determined by the repetition rate of the pump source. The generated mid-infrared pulses can be expressed as (n is an integer), while they are passively referenced to the frequency of the CW laser . Thus, the mid-infrared OMFC is formed without any active CEP control processes once the repetition rate of the pump source is stabilized. The number of comb teeth of the generated OMFCs can reach or more. When a common mid-infrared CW QCL is used to generate two OMFCs with slightly different repetition rates, passive mutual coherence between the two mid-infrared combs is achieved. The scheme can be further extended to other wavelength DCS by replacing the operating wavelength of the CW QCL seed. Typically, far-infrared DCS is expected to be obtained by combining appropriate crystals, such as [48] and OP-GaAs [49].
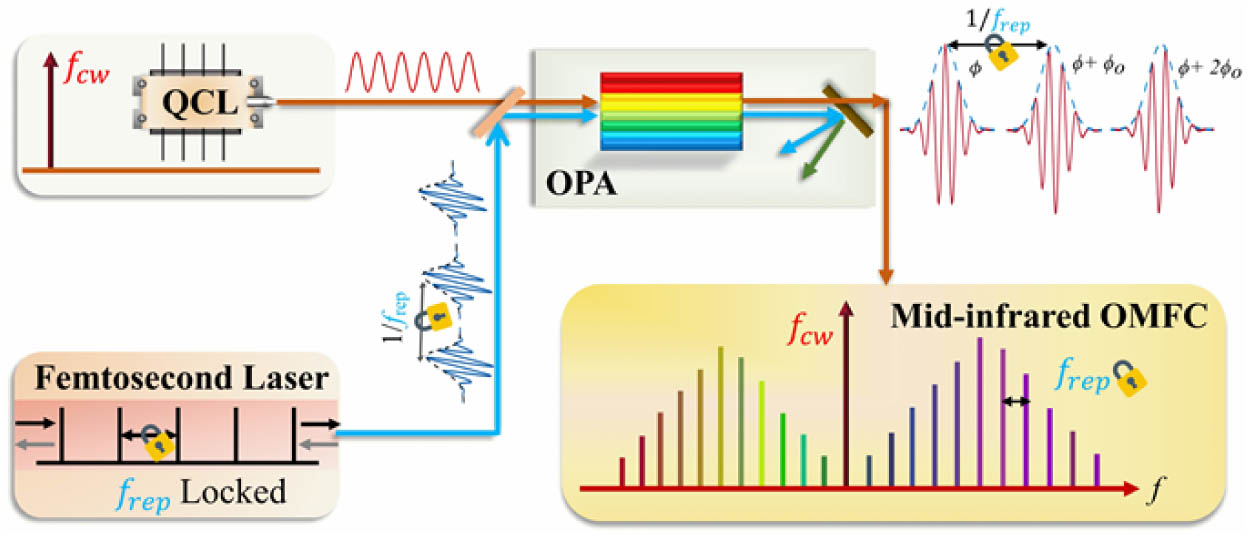
Figure 1.Schematic of an individual mid-infrared OMFC. A mid-infrared CW ICL/QCL is combined with a near-infrared femtosecond laser, whose repetition rate
3. RESULTS AND DISCUSSION
The experimental setup of the mid-infrared DCS is shown in Fig. 2(a). Two near-infrared Yb-doped femtosecond pump sources served as the pump source for the OPA processes, whose repetition rates () were loosely referenced to a common rubidium (Rb) clock at a low feedback bandwidth of 30 Hz. A tunable CW QCL (3.71–3.9 μm, Daylight, TLS-SK-41038-HHG, less than 5 MHz linewidth for an integration time of 100 ms) or a distributed feedback CW ICL (fixed operating wavelength of 3.37 μm, Nanoplus, NP-ICL-3370-TO66-HC, less than 3 MHz linewidth) was used as the seed for mid-infrared comb generation. The CW seed was equally split into two OPAs, which used identical 25 mm long MgO-doped periodically poled lithium niobate (PPLN) crystals (CTL Photonics, fan-out grating, 25.0–30.5 μm). Subsequently, mid-infrared OMFCs were obtained. The output power and spectra obtained directly from the OPAs differed for various crystal periods and CW wavelengths. The maximum output power and spectral coverage exceeded 400 mW and 400 nm, respectively, which enabled the further achievement of supercontinuum broadening in a highly nonlinear fiber (HNLF) or waveguide. More detailed discussions about their noise characteristics and spectral tunability can be found in our previous works [50,51]. To investigate the absorption information of the gas mixture, the two mid-infrared OMFCs were combined and then passed through a multipass gas cell ( path length, AMAC-76LW from Aerodyne). A balanced HgCdTe detector (QubeDT system) was used to acquire the heterodyne signal, and its output was fed into a 12 bit analogue-to-digital acquisition card (Alazar Tech, ATS9350). To remove the fluctuation of the repetition rate offset of the two OMFCs and obtain the mode-resolved DCS, an adaptive sampling signal, extracted by introducing a CW laser as the frequency intermedium, was used as the external clock to resample the mid-infrared heterodyne signal [48,52]. In addition, experimental works without the adaptive sampling method were also performed. The data acquisition process was triggered by a sharp falling edge of the interferogram, which can be treated as an elementary data phase correction [4,53]. The comparison results with and without the adaptive sampling method showed negligible differences for the spectral measurement of gases at a total pressure of 1 atm as shown in Fig. 7 (Appendix A). This indicates that compared to full-referenced DCS, our DCS without the adaptive sampling method can provide adequate precision for most practical applications in open-path environments (typically at 1 atm pressure), including combustion, exhaust emissions of the engines, and atmospheric monitoring.
![]()
Figure 2.Mode-resolved DCS spectra. (a) Schematic of the DCS setup. Two OMFCs were combined and then passed through a multipass gas cell. After spectral filtering, the heterodyne signal was detected by a balanced HgCdTe detector retrieved to an optical domain. BS, beam splitter; G, mid-infrared grating. (b) Typical detector signal with multiple interferograms. (c) Retrieved DCS spectrum. One hundred spectra, each with a recording time of
To evaluate our mid-infrared DCS, the tunable CW QCL was initially used as the seed, and its operating wavelength was set as 3.85 μm. The repetition rate offset of the pump sources was set to 600 Hz to achieve a single spectral measurement of . An optical filter composed of a mid-infrared reflective diffraction grating and a slit was introduced to adjust the measured spectral range. A typical detector signal with multiple interferograms is shown in Fig. 2(b). A continuous data stream of 100 s was recorded and then divided into 100 parts. The 100 parts, each with a recording time of 1 s, were averaged. The averaged interferogram was fourfold zero filled to interpolate the spectrum [27]. The spectrum obtained after the Fourier transform without other post-data processes is depicted in Fig. 2(c). The peak signal-to-noise ratio (SNR) was calculated to be 490 at approximately 80 THz. The average SNR across the entire spectrum from 78.2 to 87.6 THz is 180. The figure of merit, defined as , is , where () is the number of comb teeth and (100 s) is the measurement time. The noise-equivalent absorption coefficient at 1 s time-averaging per comb line, defined as , is . The enlarged plots in Figs. 2(d) and 2(e) reveal a clear cardinal-sine shape, which is the expected instrumental line shape in a nonapodized spectrum. The dips in Fig. 2(d) represent mode-resolved gas absorption profiles of , and . The spectral resolution, determined by the repetition rates of the pump sources, is 108 MHz. The red curve, computed from the HITRAN database, agrees well with the experimental results. The FWHM of individual heterodyne comb teeth is in the radio-frequency (RF) domain ( in the optical domain), which indicates the mutual coherence between our OMFCs.
Figure 3(a) shows a typical optical spectrum retrieved from a single interferogram coherently averaged at times when the wavelength of the QCL was 3.72 μm. Here the repetition rate offset of the pump sources was set as 2.4 kHz, and the nonaliasing spectral range was . The multipass gas cell was filled with a gas mixture (, and ) in buffer gas at a total pressure of 4 mbar. The overall background spectrum was removed by fitting the spectral baseline to extract the gas absorption lines as shown in Fig. 3(b). The theoretical results of different gases from the HITRAN database are represented using different color curves. All the absorption lines from , and are consistent with the theoretical profiles as shown in Figs. 3(c)–3(f). The FWHM of the Doppler-broadened rovibrational lines is . After comparison with the theoretical profiles, the concentrations and compositions of the gas mixture can be derived. All the absorption lines from in the measured spectral range can be observed, which could be attributed to the residual water vapor in the gas cell. The concentration of was calculated to be 6%, according to the gas absorption strength. There are some unexpected absorption lines that cannot be inferred from the open gas information of the HITRAN database. Portions of the unknown gas absorption lines, which may originate from impurities in the gas mixture, are shown in Figs. 3(e) and 3(f). The experimental results demonstrate the full potential of our DCS system for the quantitative analysis of gas species and concentrations.
![]()
Figure 3.DCS spectra of a mixture of gases. (a) Optical spectrum retrieved from a single interferogram coherently averaged 240,000 times. (b) Comparison results of the extracted gas absorption lines (blue line) and the theoretical profiles from the HITRAN database (light grey curve for
Our mid-infrared DCS has the well spectral tunability by adjusting the PPLN periods or the operating wavelength of the common CW laser. As shown in Fig. 4, a spectral coverage ranging nearly from 3.3 to 4.0 μm was achieved by stitching the measured DCS spectra, each of which was averaged in a time of 100 s. Here the DCS spectra seeded by QCL were measured mainly by adjusting the operating wavelength of the CW laser at a step of . For the ICL seed operating at a fixed wavelength of 3.37 μm, the spectral tuning was achieved by scanning the crystal periods. Owing to the low injected CW power of of the ICL, the relative intensity noise increased dramatically for the parameter fluorescence in the OPA processes [54]. This resulted in the degradation of the spectral SNR compared to that of the QCL seed, whose injected power is usually . The violet curve in Fig. 4(a) shows a figure of merit of from 3.38 to 3.43 μm. The mode-resolved spectra at different frequency regions are shown in Fig. 8 (Appendix B), revealing the good mutual coherence of our OMFCs. The extracted gas absorption lines obtained when the gas cell is filled with the molecular gases , and at a total pressure of 10 mbar are shown in Fig. 4(b). Portions of different gas absorption lines are shown in Fig. 4(c). The unexpected absorption lines of rare COS, which is generally treated as an impurity in the gas mixture, are observed near 3.45 μm. The components of the gas mixture were estimated to be , and 0.014% COS. By introducing well-designed chirped PPLN waveguides, broadband mid-infrared sources can be directly obtained by improving the phase-match bandwidth [55]. A preliminary experimental result demonstrated a mid-infrared source ranging from 1.8 to 4.2 μm as shown in Fig. 9 (Appendix C), in which a chirped PPLN crystal with a 25 mm length was used. These results demonstrate the potential of our scheme for octave-spanning mid-infrared DCS.
![]()
Figure 4.Tunable DCS spectra. (a) Measured spectra by scanning PPLN periods and adjusting the operating wavelength of the common CW laser. (b) Comparison between extracted gas absorption lines of (a) and the theoretical gas absorption profiles from the HITRAN database. The gaps are due to the electronical filter with a bandwidth of 2–48 MHz in the data acquisition processes. The weak spectral intensity and the low-frequency noises of the mid-infrared detector result in the deviations of the absorption intensity near the two gaps. (c) Portions of gas absorption lines of five gases.
Mid-infrared DCS can be used for highly sensitive molecular detection owing to the strong rovibrational absorption lines. Here we used our DCS to detect gas (which is one of the main harmful gases) with parts-per-million (ppm)-level concentration. High levels of exposure to can cause cancers as announced by the US Department of Health and Human Services in 2011 [56]. The World Health Organization (WHO) set an indoor air permissible concentration value of 0.08 ppm () of for all 30 min periods lifelong in 2010 [57]. In the experiment, the gas cell with a path length of 76 m was filled with 2.5 ppm at a total pressure of 83 mbar. As shown in Fig. 5(a), the DCS spectrum, filtered by adjusting the slit before the mid-infrared detector, was measured with an average time of 10 s. In Fig. 5(b), the maximum absorption intensity of the extracted absorption lines was , and these absorption lines agree well with the theoretical results. The standard deviation of the residuals, limited by the residual baseline fluctuations in the retrieved spectrum, is . The sensitivity of is considered as the concentration level when the absorption intensity of absorption lines in the measurement spectral region equals the value of [5]. According to the simulation results in open-path environments, the sensitivity of is calculated to be in a measurement time of 10 s, which is lower than the permission concentration level of 0.08 ppm. Moreover, narrowing the measured spectral range or increasing the measurement time can further improve the sensitivity due to the higher SNRs. These results demonstrate the potential of our mid-infrared DCS for the sensitive measurement of harmful gases.
![]()
Figure 5.DCS spectra of
In the experiment, the commercial CW ICL/QCL was kept relatively stable by controlling the operating current and temperature. The frequency fluctuations of the CW seeds result in the entire frequency shift of the mid-infrared OMFCs, which also mainly influences the frequency accuracy of our DCS. In this study, we used a mid-infrared wavelength meter (Bristol 771B, 0.75 pm accuracy) to measure the optical frequency of the CW seeds. The standard deviation of the frequency fluctuations of the QCL was , recorded with a single measurement time of and a total measurement time of 30 min, whereas that of the ICL was , as shown in Fig. 10 (Appendix D). The measured results are comparable to those of the frequency accuracy of the wavelength meter, which was assessed by measuring the frequency of a narrow-linewidth near-infrared CW diode (1560 nm, OEwaves, linewidth ) referenced to an Er-doped fiber comb based on an - structure [26]. If necessary, the mid-infrared CW laser can be further referenced to an optical clock or a stabilized frequency comb [24]. For further evaluation of the influence of our CW frequency shifts on the absorption spectrum measurement, the portion of absorption lines of the gas mixture of , and was properly fitted to extract the center frequency as shown in Fig. 6(a). The total pressure of the 76 m multipass cell was 10 mbar at 296 K. The residual between the measured spectrum and its fit has a standard deviation of 0.7%, which shows a good agreement. The optical frequency was retrieved from the RF domain according to the CW frequency calibrated by the center frequency of one of the gas absorption lines and the repetition rates referenced to a Rb clock. The statistical distribution of 10 continuous frequency measurements for the line position is shown in Fig. 6(b), in which the CW frequency was treated as a constant in the total measurement time of 100 s. The measured statistical uncertainty of the center frequency is . For the Gaussian fit, the inherent fit uncertainty of the center of the gas absorption lines can be theoretically expressed as , where is the FWHM of and is the number of measured points across the FWHM [40,58]. The value is calculated to be for the gas absorption line . The SNR and (repetition rate of OMFC) are 220 and 108 MHz, respectively. Compared to the FWHM of the absorption lines P(10), which is slightly broader than the Doppler-broadened linewidth of , the influence of CW frequency shift on the measurements of gas concentration and components can be negligible in our experiment. On the other hand, the continuous operation testing in a combustion lab demonstrated the practical applications of our DCS in industrial environments as shown in
![]()
Figure 6.Line parameter measurements. (a) Portions of the gas absorption lines of the gas mixture of
4. CONCLUSION
We proposed and demonstrated a broad mid-infrared DCS based on the OMFC technique, passively referenced to a common commercial CW QCL or ICL. Mutual coherence was established without any fast feedback circuits or post-phase corrections, which is favorable for simplifying the architecture and improving the robustness of the DCS. The direct output spectral range reached several hundred nanometers with an average output power exceeding several hundred milliwatts (mW), which can be applied in nonlinear spectroscopy or lossy measurement environments. By introducing a PPLN waveguide, an octave-spanning spectrum is expected to be achieved. Furthermore, the scheme can be extended to the far-infrared region, whereas the OMFC concept has been demonstrated in the near-infrared domain [48]. On the other hand, the measurements of multiple gas species such as at a ppm concentration were performed. The long-term stability, high-spectral SNR, and rapid measurement capacity of our DCS were effectively verified, which equal or exceed the high-performance mid-infrared Fourier-transform spectrometers [10,15,59]. With continued development, we anticipate that our optical–optical-modulated DCS with high robustness, coherence, and stability will become a deployable spectroscopic tool offering great resolution and sensitivity in fundamental physics studies and field applications in the future.
APPENDIX A: REAL-TIME COHERENT AVERAGING
Real-time coherent averaging was performed based on an FPGA module. The data acquisition process was triggered by a sharp falling edge of the interferogram to remove the possible time jitter, which can be treated as an elementary phase correction [
![]()
Figure 7.(a) Comparison of results with and without the adaptive sampling method at a measurement time of 10 s. A 30 cm optical path cell is filled with 10%
APPENDIX B: MID-INFRARED FREQUENCY-AGILE DCS
To verify the frequency agility of our OMFCs, the original streams at different injected CW wavelengths as shown in Fig.?
![]()
Figure 8.Mode-resolved DCS spectra at different CW operating wavelengths. The red curves show the profiles computed from the HITRAN database using experimental parameters.
APPENDIX C: OCTAVE SPECTRUM OF OMFCS
Broadband mid-infrared DCS is of great importance for the parallel measurement of multiple gas species. The output spectral range of our OMFCs was limited by the phase-matching bandwidth of the fan-out grating PPLN. In this study, we achieved the spectral broadening of our OMFCs by introducing a cascade OPA process and combining the supercontinuum technique. As shown in Fig.?
![]()
Figure 9.(a) Schematic of the spectral broadening of the OMFC. The generated near-infrared idler after the OPA process, which was first spectrally broadened, served as the signal in the next OPA process. Broadband mid-infrared pulses were obtained when a chirped PPLN crystal was used in the OPA process. HWP, half-wave plate; PBS, polarizing beam splitter; DM, dichroic mirror; PPLN, periodically poled lithium niobate crystal; LP, long-pass filter; HNLF, highly nonlinear fiber; D, delay line; APPLN, aperiodically poled lithium niobate crystal; Ge, AR-coated germanium window. (b) Measured mid-infrared spectrum after the cascade OPA processes.
APPENDIX D: FREQUENCY ACCURACY OF OMFCs
The frequency accuracy of the common mid-infrared CW seeds directly determined the frequency accuracy of our DCS. Here we used a mid-infrared wavelength meter (Bristol 771B, 0.75?pm accuracy) to measure the optical frequency of the two CW seeds. The frequency accuracy of the wavelength meter is guaranteed by continuous calibration with a built-in He–Ne laser. To further evaluate the inherent accuracy of the wavelength meter, the optical frequency of a near-infrared CW diode (1560?nm, OEwaves, linewidth ), referenced to a stabilized frequency comb [
![]()
Figure 10.Measured frequency stability of (a) near-infrared CW laser referenced to a fiber frequency comb, (b) mid-infrared CW ICL, and (c) QCL.
References
[1] A. Rolland, P. Li, N. Kuse, J. Jiang, M. Cassinerio, C. Langrock, M. E. Fermann. Ultra-broadband dual-branch optical frequency comb with 10−18 instability. Optica, 5, 1070-1077(2018).
[2] T. W. Hänsch. Nobel lecture: passion for precision. Rev. Mod. Phys., 78, 1297-1309(2006).
[3] N. Picqué, T. W. Hänsch. Frequency comb spectroscopy. Nat. Photonics, 13, 146-157(2019).
[4] A. V. Muraviev, V. O. Smolski, Z. E. Loparo, K. L. Vodopyanov. Massively parallel sensing of trace molecules and their isotopologues with broadband subharmonic mid-infrared frequency combs. Nat. Photonics, 12, 209-214(2018).
[5] G. Ycas, F. R. Giorgetta, K. C. Cossel, E. M. Waxman, E. Baumann, N. R. Newbury, I. Coddington. Mid-infrared dual-comb spectroscopy of volatile organic compounds across long open-air paths. Optica, 6, 165-168(2019).
[6] S. A. Meek, A. Hipke, G. Guelachvili, T. W. Hänsch, N. Picqué. Doppler-free Fourier transform spectroscopy. Opt. Lett., 43, 162-165(2018).
[7] C. Wang, Z. Deng, C. Gu, Y. Liu, D. Luo, Z. Zhu, W. Li, H. Zeng. Line-scan spectrum-encoded imaging by dual-comb interferometry. Opt. Lett., 43, 1606-1609(2018).
[8] E. Hase, T. Minamikawa, T. Mizuno, S. Miyamoto, R. Ichikawa, Y. Hsieh, K. Shibuya, K. Sato, Y. Nakajima, A. Asahara, K. Minoshima, Y. Mizutani, T. Iwata, H. Yamamoto, T. Yasui. Scan-less confocal phase imaging based on dual-comb microscopy. Optica, 5, 634-643(2018).
[9] M. Tamamitsu, K. Toda, H. Shimada, T. Honda, M. Takarada, K. Okabe, Y. Nagashima, R. Horisaki, T. Ideguchi. Label-free biochemical quantitative phase imaging with mid-infrared photothermal effect. Optica, 7, 359-366(2020).
[10] J. Mandon, G. Guelachvili, N. Picqué. Fourier transform spectroscopy with a laser frequency comb. Nat. Photonics, 3, 99-102(2009).
[11] K. Hiramatsu, Y. Luo, T. Ideguchi, K. Goda. Rapid-scan Fourier-transform coherent anti-Stokes Raman scattering spectroscopy with heterodyne detection. Opt. Lett., 42, 4335-4338(2017).
[12] C. Gohle, B. Stein, A. Schliesser, T. Udem, T. W. Hänsch. Frequency comb vernier spectroscopy for broadband, high-resolution, high-sensitivity absorption and dispersion spectra. Phys. Rev. Lett., 99, 263902(2007).
[13] S. A. Diddams, L. Hollberg, V. Mbele. Molecular fingerprinting with the resolved modes of a femtosecond laser frequency comb. Nature, 445, 627-630(2007).
[14] L. Rutkowski, J. Morville. Broadband cavity-enhanced molecular spectra from Vernier filtering of a complete frequency comb. Opt. Lett., 39, 6664-6667(2014).
[15] I. Coddington, N. Newbury, W. Swann. Dual-comb spectroscopy. Optica, 3, 414-426(2016).
[16] M. A. Abbas, Q. Pan, J. Mandon, S. M. Cristescu, F. J. M. Harren, A. Khodabakhsh. Time-resolved mid-infrared dual-comb spectroscopy. Sci. Rep., 9, 17247(2019).
[17] T. Ideguchi, S. Holzner, B. Bernhardt, G. Guelachvili, N. Picqué, T. W. Hänsch. Coherent Raman spectro-imaging with laser frequency combs. Nature, 502, 355-358(2013).
[18] K. J. Mohler, B. J. Bohn, M. Yan, G. Mélen, T. W. Hänsch, N. Picqué. Dual-comb coherent Raman spectroscopy with lasers of 1-GHz pulse repetition frequency. Opt. Lett., 42, 318-321(2017).
[19] J. T. Friedlein, E. Baumann, K. A. Briggman, G. M. Colacion, F. R. Giorgetta, A. M. Goldfain, D. I. Herman, E. V. Hoenig, J. Hwang, N. R. Newbury, E. F. Perez, C. S. Yung, I. Coddington, K. C. Cossel. Dual-comb photoacoustic spectroscopy. Nat. Commun., 11, 3152(2020).
[20] B. Bernhardt, A. Ozawa, P. Jacquet, M. Jacquey, Y. Kobayashi, T. Udem, R. Holzwarth, G. Guelachvili, T. W. Hänsch, N. Picqué. Cavity-enhanced dual-comb spectroscopy. Nat. Photonics, 4, 55-57(2010).
[21] N. Hoghooghi, R. J. Wright, A. S. Makowiecki, W. C. Swann, E. M. Waxman, I. Coddington, G. B. Rieker. Broadband coherent cavity-enhanced dual-comb spectroscopy. Optica, 6, 28-33(2018).
[22] A. Hipke, S. A. Meek, T. Ideguchi, T. W. Hänsch, N. Picqué. Broadband Doppler-limited two-photon and stepwise excitation spectroscopy with laser frequency combs. Phys. Rev. A, 90, 011805(2014).
[23] S. Reinhardt, E. Peters, T. W. Hänsch, T. Udem. Two-photon direct frequency comb spectroscopy with chirped pulses. Phys. Rev. A, 81, 033427(2010).
[24] I. Coddington, W. C. Swann, N. R. Newbury. Coherent multiheterodyne spectroscopy using stabilized optical frequency combs. Phys. Rev. Lett., 100, 013902(2008).
[25] G. Truong, E. M. Waxman, K. C. Cossel, E. Baumann, A. Klose, F. R. Giorgetta, W. C. Swann, N. R. Newbury, I. Coddington. Accurate frequency referencing for fieldable dual-comb spectroscopy. Opt. Express, 24, 30495-30504(2016).
[26] Z. Zhu, Y. Liu, D. Luo, C. Gu, L. Zhou, G. Xie, Z. Deng, W. Li. Tunable optical frequency comb from a compact and robust Er:fiber laser. High Power Laser Sci. Eng., 8, e17(2020).
[27] Z. Chen, M. Yan, T. W. Hänsch, N. Picqué. A phase-stable dual-comb interferometer. Nat. Commun., 9, 1(2018).
[28] Z. Chen, T. W. Hänsch, N. Picqué. Mid-infrared feed-forward dual-comb spectroscopy. Proc. Natl. Acad. Sci. USA, 116, 3454-3459(2019).
[29] Z. Chen, T. W. Hänsch, N. Picqué. Upconversion mid-infrared dual-comb spectroscopy(2020).
[30] A. Schliesser, N. Picqué, T. W. Hänsch. Mid-infrared frequency combs. Nat. Photonics, 6, 440-449(2012).
[31] G. Ycas, F. R. Giorgetta, J. T. Friedlein, D. Herman, K. C. Cossel, E. Baumann, N. R. Newbury, I. Coddington. Compact mid-infrared dual-comb spectrometer for outdoor spectroscopy. Opt. Express, 28, 14740-14752(2020).
[32] G. Cerullo, A. Baltuška, O. D. Mücke, C. Vozzi. Few-optical-cycle light pulses with passive carrier-envelope phase stabilization. Laser Photon. Rev., 5, 323-351(2011).
[33] S. C. Kumar, A. Esteban-Martin, T. Ideguchi, M. Yan, S. Holzner, T. W. Hänsch, N. Picqué, M. Ebrahim-Zadeh. Few-cycle, broadband, mid-infrared optical parametric oscillator pumped by a 20-fs Ti: sapphire laser. Laser Photon. Rev., 8, L86-L91(2014).
[34] Y. Jin, S. M. Cristescu, F. J. M. Harren, J. Mandon. Femtosecond optical parametric oscillators toward real-time dual-comb spectroscopy. Appl. Phys. B, 119, 65-74(2015).
[35] M. Yu, Y. Okawachi, A. G. Griffith, N. Picqué, M. Lipson, A. L. Gaeta. Silicon-chip-based mid-infrared dual-comb spectroscopy. Nat. Commun., 9, 1869(2018).
[36] L. A. Sterczewski, M. Bagheri, C. Frez, C. L. Canedy, I. Vurgaftman, J. R. Meyer. Mid-infrared dual-comb spectroscopy with room-temperature bi-functional interband cascade lasers and detectors. Appl. Phys. Lett., 116, 141102(2020).
[37] G. Villares, A. Hugi, S. Blaser, J. Faist. Dual-comb spectroscopy based on quantum-cascade-laser frequency combs. Nat. Commun., 5, 1-9(2014).
[38] B. Kuyken, T. Ideguchi, S. Holzner, M. Yan, T. W. Hänsch, J. V. Campenhout, P. Verheyen, S. Coen, F. Leo, R. Baets, G. Roelkens, N. Picqué. An octave-spanning mid-infrared frequency comb generated in a silicon nanophotonic wire waveguide. Nat. Commun., 6, 5192(2015).
[39] Z. Zhao, B. Wu, X. Wang, Z. Pan, Z. Liu, P. Zhang, X. Shen, Q. Nie, S. Dai, R. Wang. Mid-infrared supercontinuum covering 2.0–16 μm in a low-loss telluride single-mode fiber. Laser Photon. Rev., 11, 1700005(2017).
[40] E. Baumann, F. R. Giorgetta, W. C. Swann, A. M. Zolot, I. Coddington, N. R. Newbury. Spectroscopy of the methane
[41] F. Zhu, A. Bicer, R. Askar, J. Bounds, A. A. Kolomenskii, V. Kelessides, M. Amani, H. A. Schuessler. Mid-infrared dual frequency comb spectroscopy based on fiber lasers for the detection of methane in ambient air. Laser Phys. Lett., 12, 095701(2015).
[42] G. Ycas, F. R. Giorgetta, E. Baumann, I. Coddington, D. Herman, S. A. Diddams, N. R. Newbury. High-coherence mid-infrared dual-comb spectroscopy spanning 2.6 to 5.2 μm. Nat. Photonics, 12, 202-208(2018).
[43] T. Ideguchi, T. Nakamura, Y. Kobayashi, K. Goda. Kerr-lens mode-locked bidirectional dual-comb ring laser for broadband dual-comb spectroscopy. Optica, 3, 748-753(2016).
[44] X. Zhao, T. Li, Y. Liu, Q. Li, Z. Zheng. Polarization-multiplexed, dual-comb all-fiber mode-locked laser. Photon. Res., 6, 853-857(2018).
[45] G. Millot, S. Pitois, M. Yan, T. Hovhannisyan, A. Bendahmane, T. W. Hänsch, N. Picqué. Frequency-agile dual-comb spectroscopy. Nat. Photonics, 10, 27-30(2015).
[46] M. Yan, P. Luo, K. Iwakuni, G. Millot, T. W. Hänsch, N. Picqué. Mid-infrared dual-comb spectroscopy with electro-optic modulator. Light Sci. Appl., 6, e17076(2017).
[47] C. Gu, Z. Zuo, D. Luo, Z. Deng, Y. Liu, M. Hu, W. Li. Passive coherent dual-comb spectroscopy based on optical-optical modulation with free running lasers. PhotoniX, 1, 7(2020).
[48] F. Cappelli, G. Campo, I. Galli, G. Giusfredi, S. Bartalini, D. Mazzotti, P. Cancio, S. Borri, B. Hinkov, J. Faist, P. De Natale. Frequency stability characterization of a quantum cascade laser frequency comb. Laser Photon. Rev., 10, 623-630(2016).
[49] Q. Fu, L. Xu, S. Liang, P. C. Shardlow, D. P. Shepherd, S.-U. Alam, D. J. Richardson. High-beam-quality, watt-level, widely tunable, mid-infrared OP-GaAs optical parametric oscillator. Opt. Lett., 44, 2744-2747(2019).
[50] C. Gu, Z. Zuo, D. Luo, D. Peng, Y. Di, X. Zou, L. Yang, W. Li. High-repetition-rate femtosecond mid-infrared pulses generated by nonlinear optical modulation of continuous-wave QCLs and ICLs. Opt. Lett., 44, 5848-5851(2019).
[51] C. Gu, Z. Zuo, D. Peng, Y. Di, X. Zou, D. Luo, Y. Liu, W. Li. High-repetition-rate mid-IR femtosecond pulse synthesis from two mid-IR CW QCL-seeded OPAs. Opt. Express, 28, 27433-27442(2020).
[52] T. Ideguchi, A. Poisson, G. Guelachvili, N. Picque, T. W. Hansch. Adaptive real-time dual-comb spectroscopy. Nat. Commun., 5, 3375(2014).
[53] D. Burghoff, Y. Yang, Q. Hu. Computational multiheterodyne spectroscopy. Sci. Adv., 2, e1601227(2016).
[54] W. Chen, J. Fan, A. Ge, H. Song, Y. Song, B. Liu, L. Chai, C. Wang, M. Hu. Intensity and temporal noise characteristics in femtosecond optical parametric amplifiers. Opt. Express, 25, 31263-31272(2017).
[55] L. Zhou, Y. Liu, H. Lou, Y. Di, G. Xie, Z. Zhu, Z. Deng, D. Luo, C. Gu, H. Chen, W. Li. Octave mid-infrared optical frequency comb from Er:fiber-laser-pumped aperiodically poled Mg:LiNbO3. Opt. Lett., 45, 6458-6461(2020).
[56] National Toxicology. NTP 12th report on carcinogens. Rep. Carcinog., 12, iii-499(2011).
[57] World Health. WHO Guidelines for Indoor Air Quality: Selected Pollutants, 103-156(2010).
[58] C. Gu, X. Zou, Z. Zuo, D. Peng, Y. Di, Y. Liu, D. Luo, W. Li. Doppler velocimeter based on dual-comb absorption spectroscopy. Photon. Res., 8, 1895-1903(2020).
[59] F. Adler, P. Masłowski, A. Foltynowicz, K. C. Cossel, T. C. Briles, I. Hartl, J. Ye. Mid-infrared Fourier transform spectroscopy with a broadband frequency comb. Opt. Express, 18, 21861-21872(2010).
[60] H. Timmers, A. Kowligy, A. Lind, F. C. Cruz, N. Nader, M. Silfies, G. Ycas, T. K. Allison, P. G. Schunemann, S. B. Papp, S. A. Diddams. Molecular fingerprinting with bright, broadband infrared frequency combs. Optica, 5, 727-732(2018).

Set citation alerts for the article
Please enter your email address
© Copyright 2018-2021 | Chinese Laser Press. All Rights Reserved 沪ICP备15018463号-20