• Photonics Research
  • Vol. 8, Issue 12, 1895 (2020)
Chenglin Gu1、†, Xing Zou1、†, Zhong Zuo, Daowang Peng, Yuanfeng Di, Yang Liu, Daping Luo, and Wenxue Li*
Author Affiliations
  • State Key Laboratory of Precision Spectroscopy, East China Normal University, Shanghai 200062, China
  • show less
    DOI: 10.1364/PRJ.398876 Cite this Article Set citation alerts
    Chenglin Gu, Xing Zou, Zhong Zuo, Daowang Peng, Yuanfeng Di, Yang Liu, Daping Luo, Wenxue Li. Doppler velocimeter based on dual-comb absorption spectroscopy[J]. Photonics Research, 2020, 8(12): 1895 Copy Citation Text show less
    Schematic and experimental layout for the gas flow velocity measurements based on DCAS. (a) Multiple absorption lines experience Doppler shifts in the line-center frequency. DCAS enables the extraction of the precise position of each absorption line center, and the flow velocity can be derived from frequency shifts of multiple absorption lines. (b) The outputs of two combs are combined and split into two subbeams for the counterpropagating arrangement. The airflow is produced in the test facility by a commercially vacuum pump. PBS, polarization beam splitter; BS, beam splitter; BP, bandpass filter; HWP, half-wave plate; BD, balanced detector.
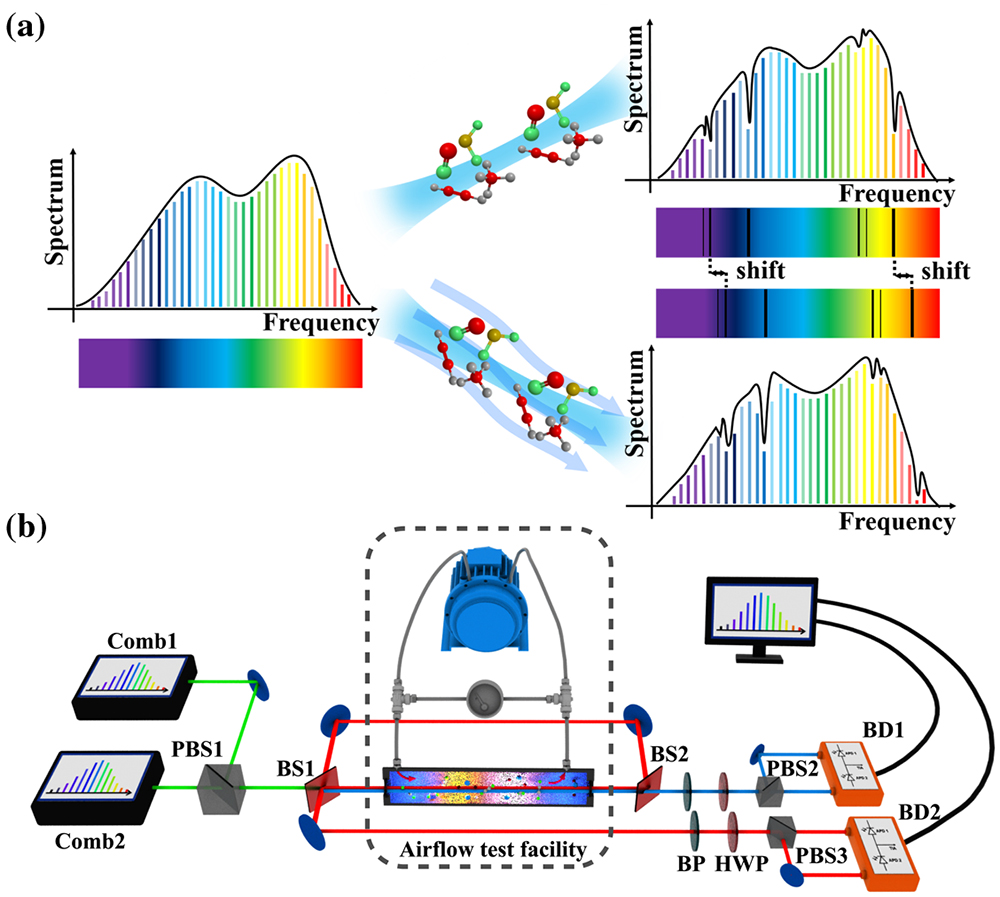
    Fig. 1. Schematic and experimental layout for the gas flow velocity measurements based on DCAS. (a) Multiple absorption lines experience Doppler shifts in the line-center frequency. DCAS enables the extraction of the precise position of each absorption line center, and the flow velocity can be derived from frequency shifts of multiple absorption lines. (b) The outputs of two combs are combined and split into two subbeams for the counterpropagating arrangement. The airflow is produced in the test facility by a commercially vacuum pump. PBS, polarization beam splitter; BS, beam splitter; BP, bandpass filter; HWP, half-wave plate; BD, balanced detector.
    Comb-mode-resolved DCAS. (a) Broadband optical spectrum (log scale) obtained via FFT from a 10-s-long recording. (b) Zoomed figures display comb-tooth-resolved spectra with absorbed energy modes resulting from C2H2 absorption. The comb-mode spectrum is resolved with an optical sampling of 108 MHz. The inset shows an individual comb tooth with a linewidth of 9 kHz in the optical scale. (c) Experimental absorption spectrum (gray curve) of static acetylene with 5 mbar is compared with a spectrum (green curve) computed from the same parameters in the HITRAN database, along with the residuals.
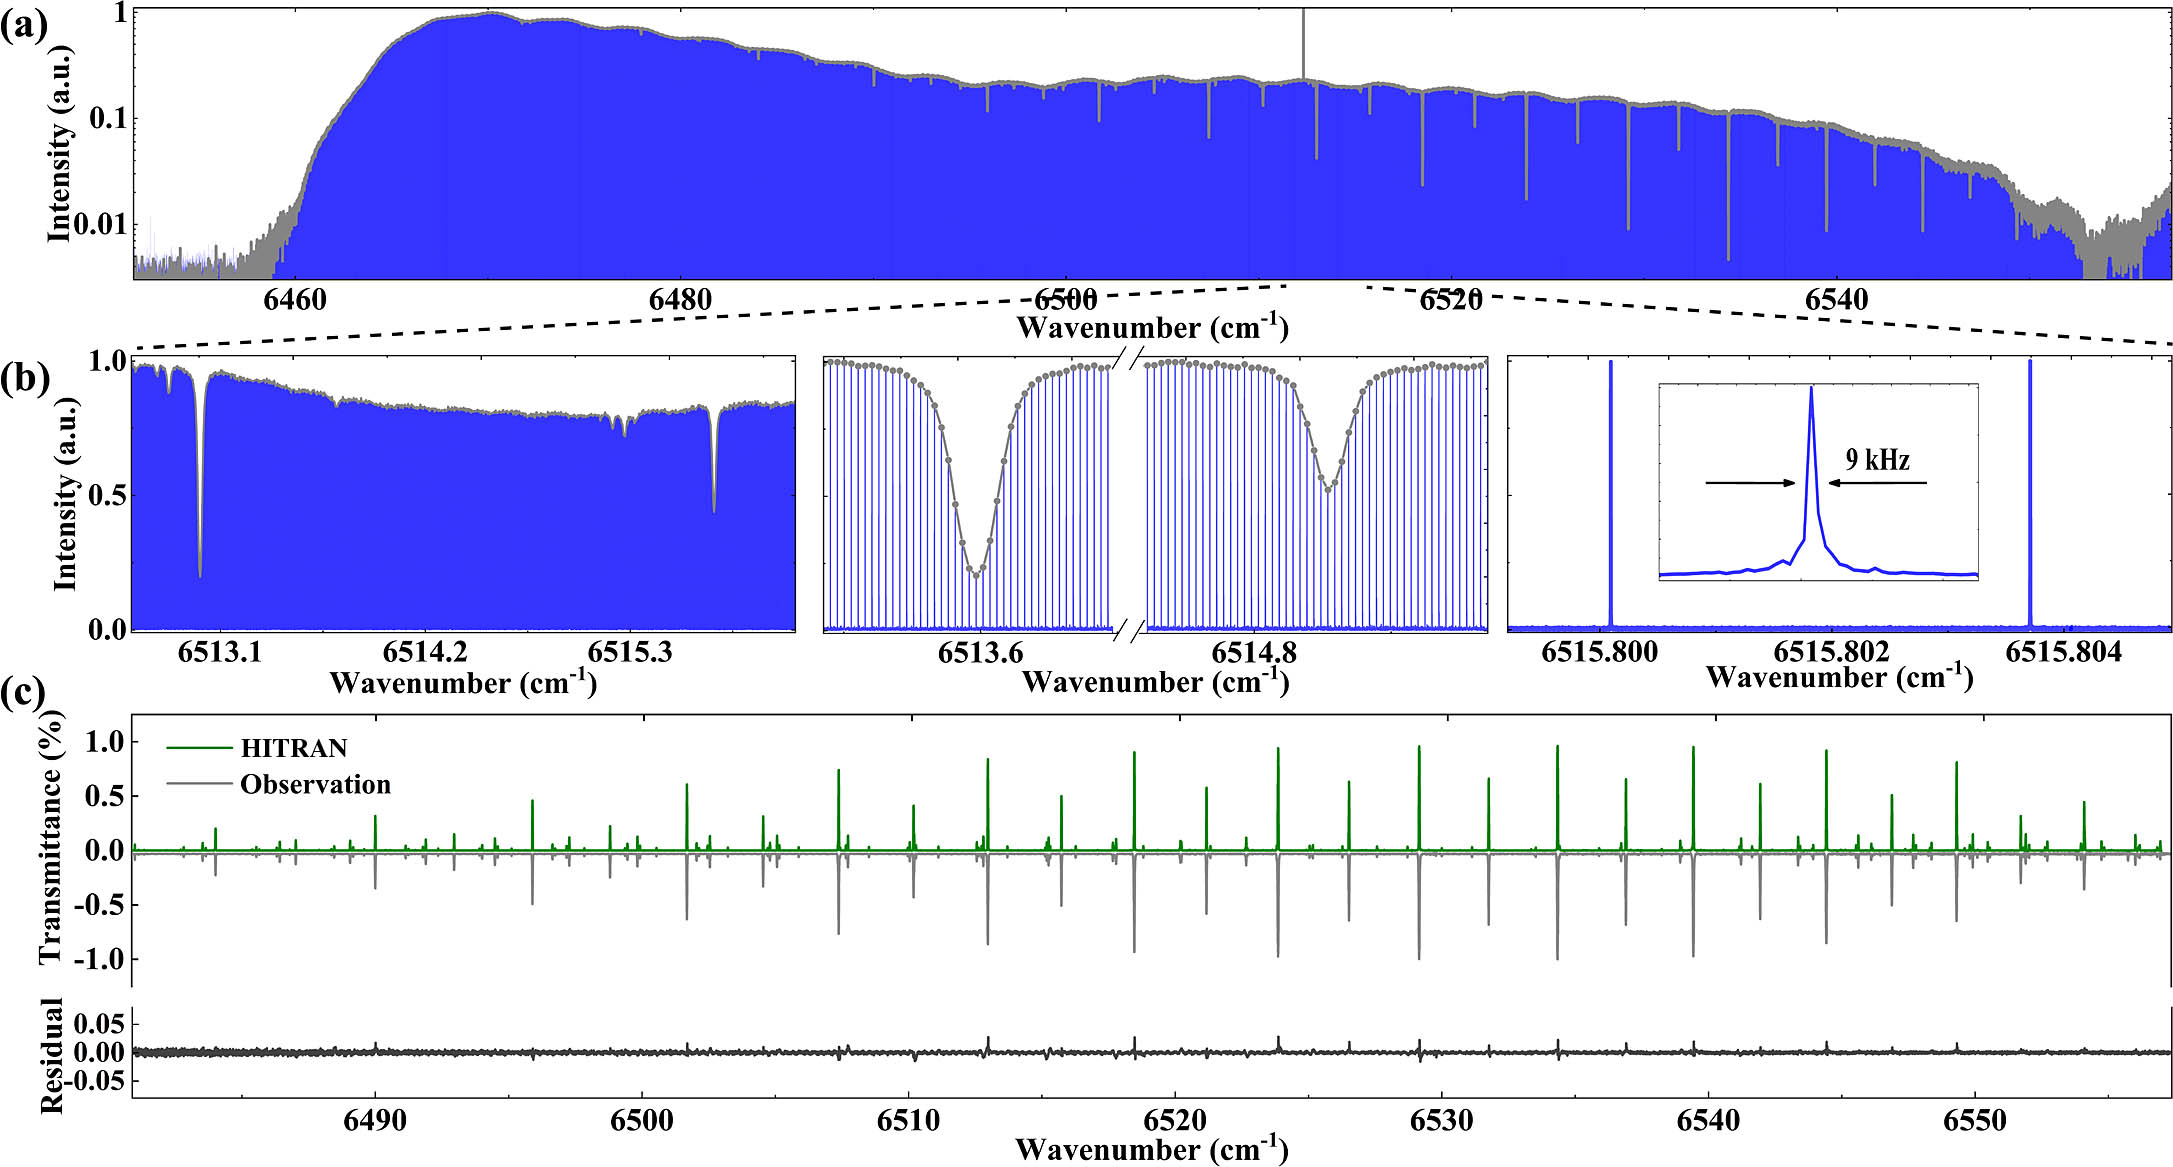
    Fig. 2. Comb-mode-resolved DCAS. (a) Broadband optical spectrum (log scale) obtained via FFT from a 10-s-long recording. (b) Zoomed figures display comb-tooth-resolved spectra with absorbed energy modes resulting from C2H2 absorption. The comb-mode spectrum is resolved with an optical sampling of 108 MHz. The inset shows an individual comb tooth with a linewidth of 9 kHz in the optical scale. (c) Experimental absorption spectrum (gray curve) of static acetylene with 5 mbar is compared with a spectrum (green curve) computed from the same parameters in the HITRAN database, along with the residuals.
    Absorption spectra of the acetylene flow at a pressure of 15 mbar from forward (blue curve) and opposite (red curve) measurements in 1 s recording time. Doppler-shifted absorption peak pairs in cyan-shaded boxes are shown in the zooms below.
    Fig. 3. Absorption spectra of the acetylene flow at a pressure of 15 mbar from forward (blue curve) and opposite (red curve) measurements in 1 s recording time. Doppler-shifted absorption peak pairs in cyan-shaded boxes are shown in the zooms below.
    Comparison between the theoretical uncertainty δVi and the standard deviation (STD) of the measured velocities in different measurement times (the curves from top to bottom corresponding to 1, 5, and 10 s, respectively).
    Fig. 4. Comparison between the theoretical uncertainty δVi and the standard deviation (STD) of the measured velocities in different measurement times (the curves from top to bottom corresponding to 1, 5, and 10 s, respectively).
    Gas flow velocity measurements with DCAS. (a) Experimental flow velocities (red dots) are derived from Doppler shifts of dozens of absorption lines. The SNR (the dotted-line from top to bottom corresponding to 0.1, 1, and 15 s measurement time, respectively) of each absorption line is applied to Eq. (1), and then extracted to calculate the statistical uncertainty at the fitting line center. The increasing number of available absorption lines is attributed to undistorted absorption lines with the signal averaging. The weighted-average flow velocities (gray curve) with different measuring uncertainties are obtained. (b) Evolution of the measuring uncertainty with the acquisition time. A linear fit with a slope of 0.469 indicates that the measuring uncertainty is inversely proportional to the square root of the measurement time.
    Fig. 5. Gas flow velocity measurements with DCAS. (a) Experimental flow velocities (red dots) are derived from Doppler shifts of dozens of absorption lines. The SNR (the dotted-line from top to bottom corresponding to 0.1, 1, and 15 s measurement time, respectively) of each absorption line is applied to Eq. (1), and then extracted to calculate the statistical uncertainty at the fitting line center. The increasing number of available absorption lines is attributed to undistorted absorption lines with the signal averaging. The weighted-average flow velocities (gray curve) with different measuring uncertainties are obtained. (b) Evolution of the measuring uncertainty with the acquisition time. A linear fit with a slope of 0.469 indicates that the measuring uncertainty is inversely proportional to the square root of the measurement time.
    Velocity measurements of static gas with DCAS. (a) Absorption peak pairs in 1 s measurement time; (b) measured flow velocities (red dot) and the SNR (brown and purple dotted lines corresponding to 1 s and 15 s recording times) extracted from multiple absorption peak pairs.
    Fig. 6. Velocity measurements of static gas with DCAS. (a) Absorption peak pairs in 1 s measurement time; (b) measured flow velocities (red dot) and the SNR (brown and purple dotted lines corresponding to 1 s and 15 s recording times) extracted from multiple absorption peak pairs.
    Experiments for various flow velocities with DCAS. (a) Flow velocity measurements with DCAS in the range from 8.72 to 44.87 m/s;(b) two selected absorption line pairs with forward (red and green curves) and opposite (yellow and purple curves) Doppler shifts in an acquisition time of 1 s at different flow velocities. The Doppler shift varies from 11.33 to 58.29 MHz with the velocity.
    Fig. 7. Experiments for various flow velocities with DCAS. (a) Flow velocity measurements with DCAS in the range from 8.72 to 44.87 m/s;(b) two selected absorption line pairs with forward (red and green curves) and opposite (yellow and purple curves) Doppler shifts in an acquisition time of 1 s at different flow velocities. The Doppler shift varies from 11.33 to 58.29 MHz with the velocity.
    Dynamic monitoring at 1 Hz over 40 s in the airflow test facility. The measured flow velocity is stepped up in a 10 s time interval. A velocity fluctuation caused by unsteady exhaust-flow ∼2 m/s is observed with the measuring uncertainty of 0.67 m/s.
    Fig. 8. Dynamic monitoring at 1 Hz over 40 s in the airflow test facility. The measured flow velocity is stepped up in a 10 s time interval. A velocity fluctuation caused by unsteady exhaust-flow 2  m/s is observed with the measuring uncertainty of 0.67 m/s.
    Chenglin Gu, Xing Zou, Zhong Zuo, Daowang Peng, Yuanfeng Di, Yang Liu, Daping Luo, Wenxue Li. Doppler velocimeter based on dual-comb absorption spectroscopy[J]. Photonics Research, 2020, 8(12): 1895
    Download Citation