
Jiejun Wang, Lei Liang, Shu Li, Song Ye, Fangyuan Wang. Correction and Implementation of Polarization-Difference Imaging Model for Underwater Target[J]. Acta Optica Sinica, 2019, 39(11): 1111003
- Acta Optica Sinica
- Vol. 39, Issue 11, 1111003 (2019)
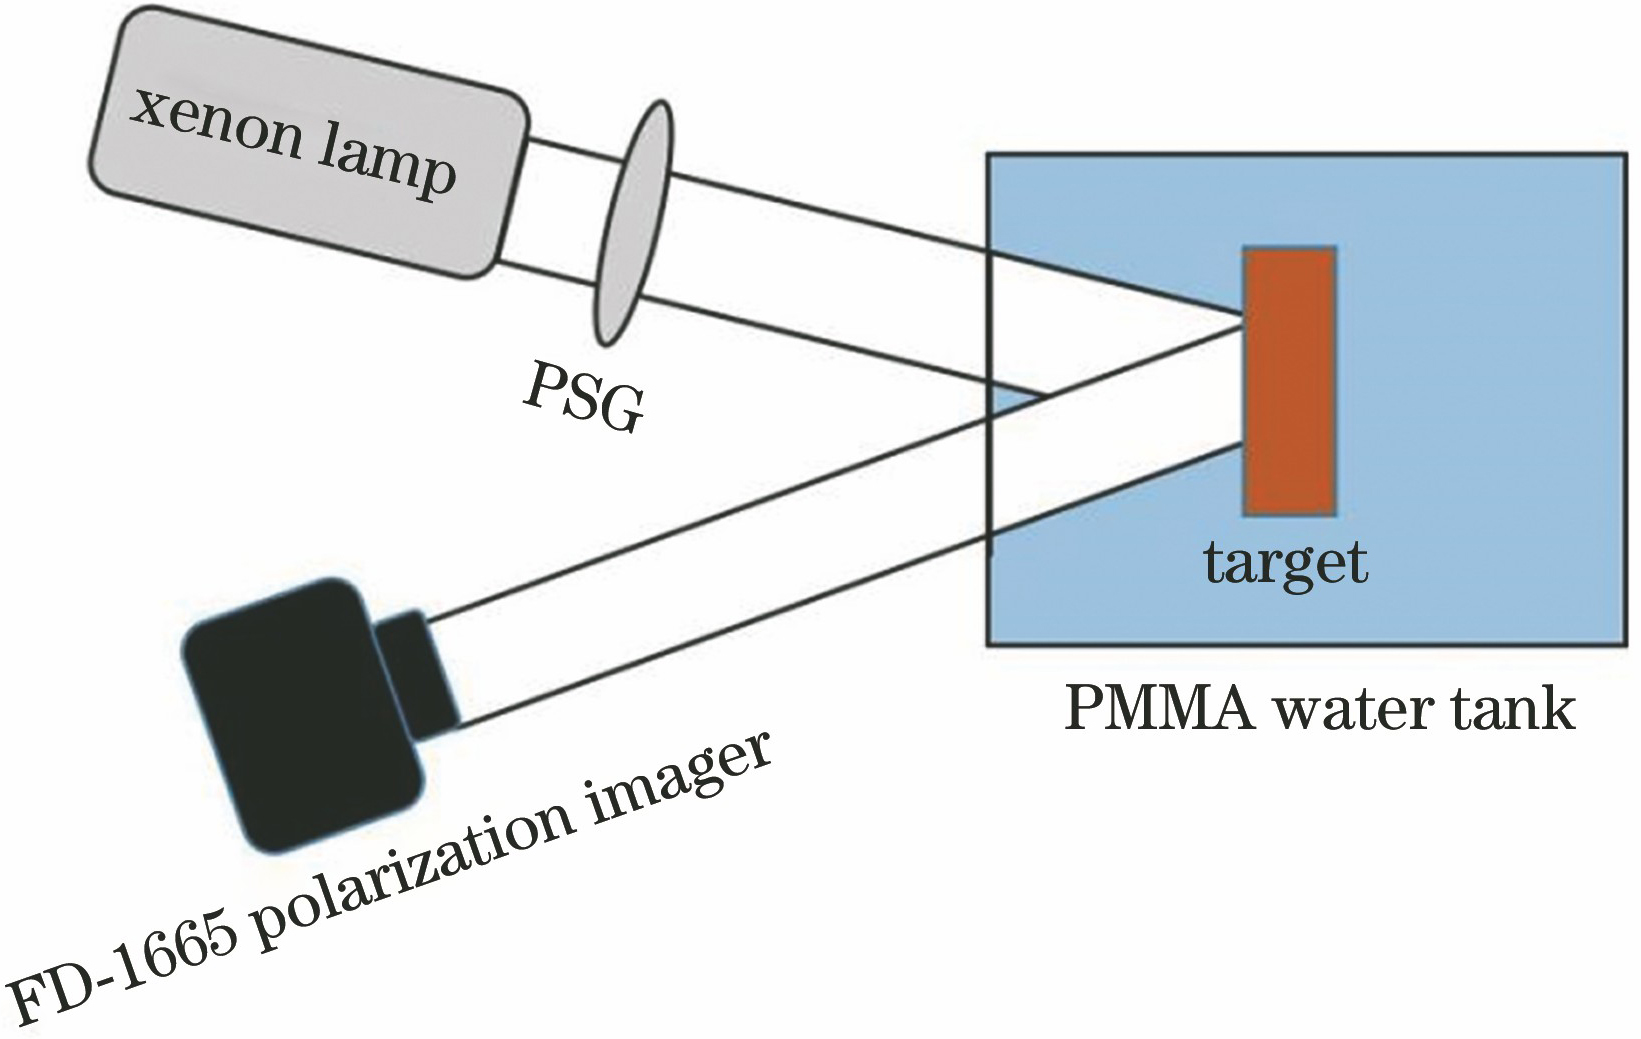
Fig. 1. Schematic of underwater imaging experimental apparatus
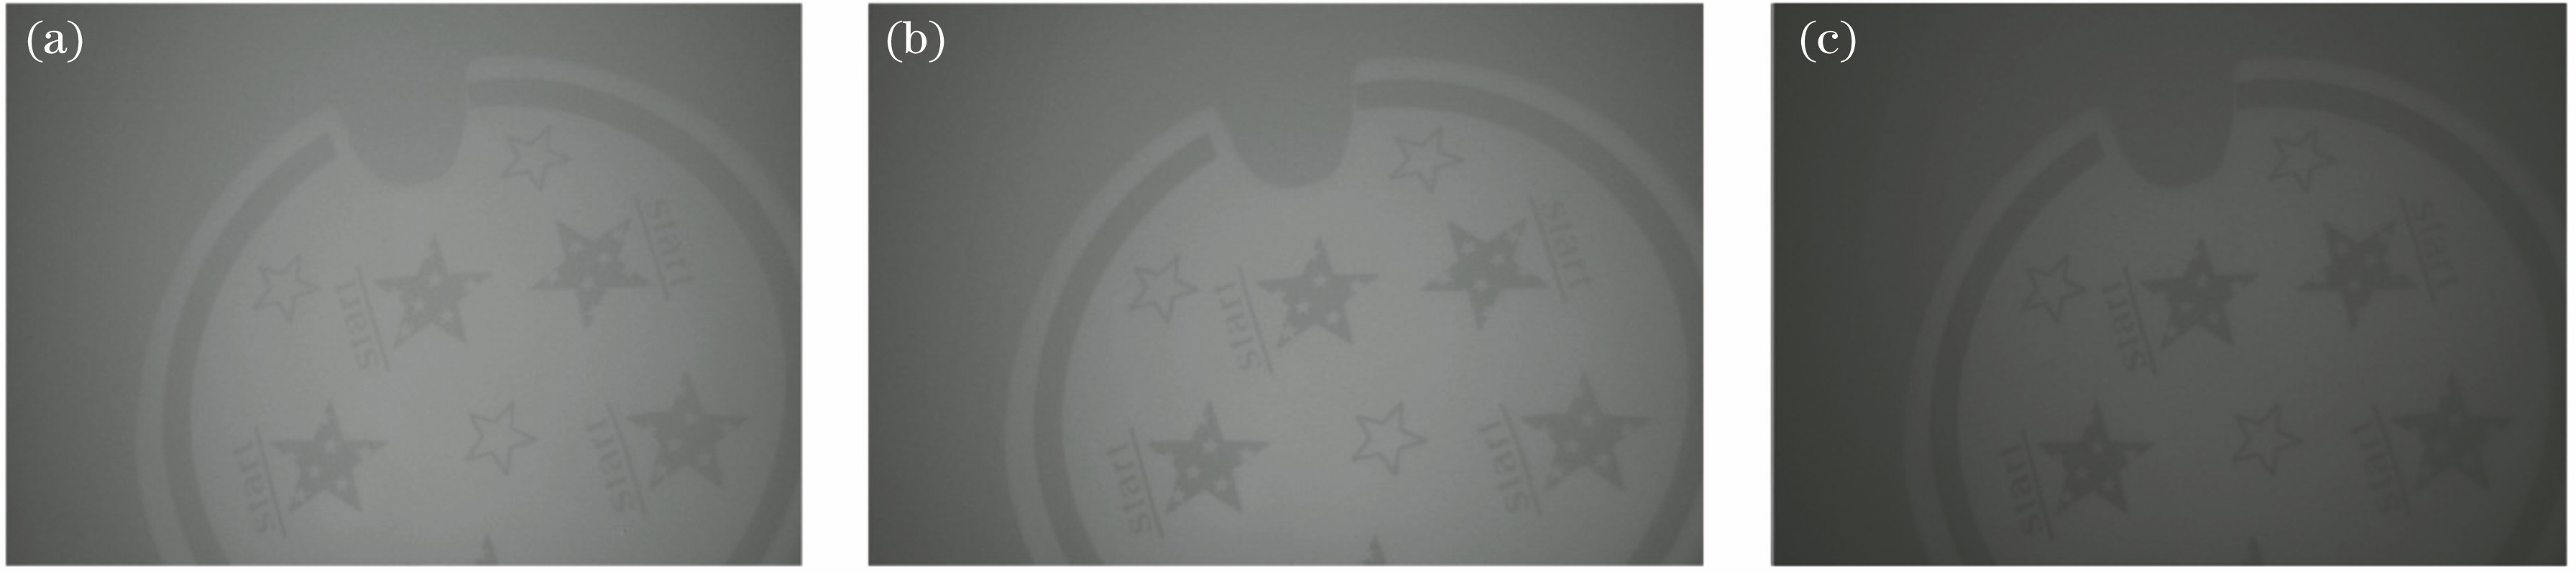
Fig. 2. Ceramic images with different linear polarization directions. (a) 0°; (b) 45°; (c) 90°
Fig. 3. Pre-processed intensity image
Fig. 4. Restored image obtained by conventional underwater polarization difference imaging model
Fig. 5. Restored scene image obtained by improved model
Fig. 6. Estimation of correction parameter ε of ceramic restoration images. (a) Relationship among correction parameter ε , contrast, and information entropy; (b) relationship among correction parameter ε , average gradient, and information entropy
Fig. 7. Comparison of glass fiber board imaging. (a) Pre-processed intensity image; (b) image restored by conventional underwater polarization difference imaging model; (c) image restored by improved model
Fig. 8. Comparison of rusty blade imaging. (a) Pre-processed intensity image; (b) image restored by conventional underwater polarization difference imaging model; (c) image restored by improved model
Fig. 9. Estimation of correction parameter ε of glass fiber board restoration images. (a) Relationship among correction parameter ε , contrast, and information entropy; (b) relationship among correction parameter ε , average gradient, and information entropy
Fig. 10. Estimation of correction parameter ε of rusty blade restoration images. (a) Relationship among correction parameter ε , contrast, and information entropy; (b) relationship among correction parameter ε , average gradient, and information entropy
|
Table 1. Comparison of experimental results
|
Table 2. Comparison of experimental results

Set citation alerts for the article
Please enter your email address
© Copyright 2018-2021 | Chinese Laser Press. All Rights Reserved 沪ICP备15018463号-20