
A. Tentori, A. Colaïtis, D. Batani. 3D Monte-Carlo model to study the transport of hot electrons in the context of inertial confinement fusion. Part II[J]. Matter and Radiation at Extremes, 2022, 7(6): 065903
- Matter and Radiation at Extremes
- Vol. 7, Issue 6, 065903 (2022)
Abstract
I. INTRODUCTION
In both the direct drive1,2 and shock ignition (SI)3–5 approaches to inertial confinement fusion (ICF), high laser intensities (–1016 W/cm2) are required to bring the hotspot to ignition conditions. At such high intensities, the laser light couples with the plasma created by the compression beams, and a population of suprathermal electrons, so-called “hot electrons,” is generated. The mechanisms responsible for this hot-electron generation are stimulated Raman scattering (SRS),6 two-plasmon decay (TPD),7 and resonant absorption (RAB).8 If sufficiently energetic, these electrons can propagate up to the inner part of the DT shell, preheating it and jeopardizing the implosion. Whereas in the standard ICF scheme the presence of hot electrons is usually deleterious, in SI their generation is driven by the high-intensity laser spike after the compression phase. Thus, if the kinetic energy of the electron beam is moderate, electrons are stopped by the high ρr of the imploding capsule, which prevents them from reaching the inner part of the DT shell. It has been suggested by some authors that if this happens, then the presence of hot electrons may even be beneficial for the implosion, since they can increase the ablation and the shock pressure.9–11
In the last decade, several experiments have been performed aimed at characterizing and at understanding the role of hot electrons in ICF and in particular in SI.12–16 Planar or spherical targets have been irradiated with laser beams with characteristics relevant to SI, generating a copious amount of hot electrons that have been characterized by exploiting the x-ray radiation emitted during their propagation. However, the interpretation of these experiments has been based on “cold” Monte-Carlo (MC) methods, which do not account for the presence of the plasma state in the targets or their hydrodynamic evolution. Therefore, a crucial task is to obtain an understanding of the margin of error introduced in these analyses and thus of their level of reliability.
In this paper, we report on two numerical investigations performed using the 3D plasma MC code presented in Paper I17 and summarized in Sec. II.
First, in Sec. III, we use this code to study the propagation of hot electrons in planar targets irradiated by laser beams in the context of ICF. The results are compared with the predictions of standard cold MC methods (e.g., Geant418) to understand how the presence of the ionized state in the target and the ablation and compression waves generated by the laser interaction affect hot-electron propagation.
In Sec. IV, we use our 3D plasma MC code to study the preheating effect induced by hot electrons on a typical SI implosion scheme. In particular, we reconsider the results presented in Ref. 19, in which the implosion of an SI capsule was simulated using the hydrodynamic code CHIC.20 In Ref. 19, the hydrodynamic simulations were conducted in a 2D geometry, considering a simplified 2D model of hot-electron propagation. To check the reliability of the CHIC models, we re-performed these simulations in a 3D geometry using our 3D MC code, considering also the hot-electron characteristics found in recent experimental campaigns. Since the MC code has not yet been implemented in hydrodynamic codes, we performed offline simulations, considering hydrodynamic profiles extracted from CHIC and evaluating the hot-electron energy deposition in the DT shell. Thus, the effect of hot electrons on the hydrodynamic evolution of the target and on the shock dynamics is not evaluated. This does allow, however, a first evaluation of the preheating effect induced by hot electrons in the inner part of the DT shell, identifying which hot-electron features are tolerated by the scheme.
II. FEATURES OF THE 3D PLASMA MC METHOD
The physics and the implementation of the 3D plasma MC code have been presented in Paper I.17 The code was developed to simulate hot-electron propagation in ionized fusion targets, with the aim of future implementation in hydrodynamic codes. The diffusion and slowing down of hot electrons are treated separately, with the use of appropriate differential cross sections (DCSs) and stopping power formulas. In particular, hot electrons propagating in plasmas can collide with other free plasma electrons, with the residual electronic structure of plasma ions, or with their nuclei. Collisions with other electrons (free or bound) are accompanied by energy transfer, while elastic collisions with nuclei are responsible for the diffusion of the beam. In this latter case, the energy transfer is limited because of the difference in masses of the two interacting particles. Beam diffusion is modeled considering scattering on free plasma electrons and on plasma nuclei. The scattering between a hot electron and free plasma electrons is modeled according to the Møller formula,21 while the elastic collision between a hot electron and a nucleus screened by other plasma particles is modeled according to the Dalitz DCS.22,23 A suitable DCS has been proposed to model the elastic scattering between a hot electron and a nucleus of a partially ionized atom, in which screening effects are due to the residual electronic structure and to other plasma particles (see Sec. III B of Ref. 17). Changes in direction due to collisions with bound electrons are not simulated. As reported in Ref. 24 and as shown later in this paper, ignoring these effects produces only a slight error, since the beam diffusion is dominated by elastic scattering on nuclei. Numerically, a “mixed” algorithm is adopted to simulate the changes in direction of hot electrons,25,26 following closely the algorithm adopted by the Penelope MC code.27,28 Notably, the algorithm separates “soft” collisions, which are described according to Goudsmit–Saunderson theory,29–31 from hard collisions, which are simulated considering a two-body interaction. The energy losses are computed in the continuous slowing down approximation, taking account of the energy transfer to free and bound electrons and the generation of plasma oscillations.32–34
Finally, the code also implements a “cold module,” i.e., a module to simulate electron propagation in cold nonionized materials. This occurs when the material temperature tends to zero and atoms are not ionized. In this case, the diffusion is modeled considering the elastic scattering on atoms to be described by the Wentzel cross section,35 and the stopping powers are taken from the NIST library.36,37
III. HOT-ELECTRON TRANSPORT IN LASER-IRRADIATED PLANAR TARGETS
A. Motivation
This section describes a numerical study of hot-electron propagation in planar targets irradiated by laser beams with characteristics relevant to ICF. In a typical laser–plasma experiment, hot electrons are characterized by exploiting the radiation emitted during their propagation in the target. In particular, the experiment is reproduced using an MC method such as Geant4, and the x-ray generation detected by the diagnostics is simulated.12,14,16,38 However, these MC methods ignore several peculiar aspects of a laser-irradiated target. First of all, the hydrodynamic evolution, i.e., the ablation and the compression waves, cannot be reproduced. Thus, in the simulation, the dimensions of the target are taken as its nominal dimensions, i.e., those in its cold unablated configuration. As explained in Ref. 16, this can be justified under the assumption that the product ρr has the same values for both the irradiated and the cold targets. However, this assumption requires the geometry to be one-dimensional and the electrons to propagate in straight lines. These conditions are usually imposed by considering a 1D plasma plume expansion driven by large laser spots. This hypothesis, which is referred to as “ρr conservation,” will be tested below. Moreover, a cold MC method does not account for the ionized state of the atoms of which the material is composed. Thus, the primary particle scatters with nuclei screened by their complete electronic structure. However, in laser-irradiated targets, hot electrons scatter with partially or completely ionized atoms and with other free plasma electrons. Therefore, the screening distances of the nuclear potentials are different in the cold and the plasma cases, which affects hot-electron propagation.
Given these considerations, we present a numerical study that reveals the margin of error introduced by using a cold MC method to reproduce a laser–plasma experiment. In particular, our plasma MC code is used to investigate electron transport in laser-irradiated targets, and the results are compared with those of Geant4 simulations. In this way, it is possible to obtain a better understanding of the phenomena governing hot-electron transport under these conditions and of the differences compared with the cold case.
B. Simulation setup and results
Let us reconsider the configuration and the results of the OMEGA experimental campaign presented in Ref. 16. In this experiment, planar multilayer targets were irradiated by a 1 ns UV laser beam with an intensity of 1016 W/cm2. The targets consisted of 500 µm diameter disks composed of a plastic (CH) ablator of thickness 175 µm, followed by a copper plate of thickness 20 µm used as tracer for hot electrons. These were mounted on a plastic slab of thickness 50 µm to avoid hot-electron recirculation. Hot electrons were generated in the coronal plasma and propagated into the target, emitting bremsstrahlung and copper Kα radiation that were collected by x-ray spectrometers. Under the assumption of a 2D Maxwellian distribution function fe(E) = (Ne/Th)exp(−E/Th), the hot-electron temperature Th and number Ne were retrieved by simulating the generation of the bremsstrahlung and the Kα signals on the diagnostics with Geant4. In the simulations, the nominal target geometry (175CH–20Cu–50CH) was used.
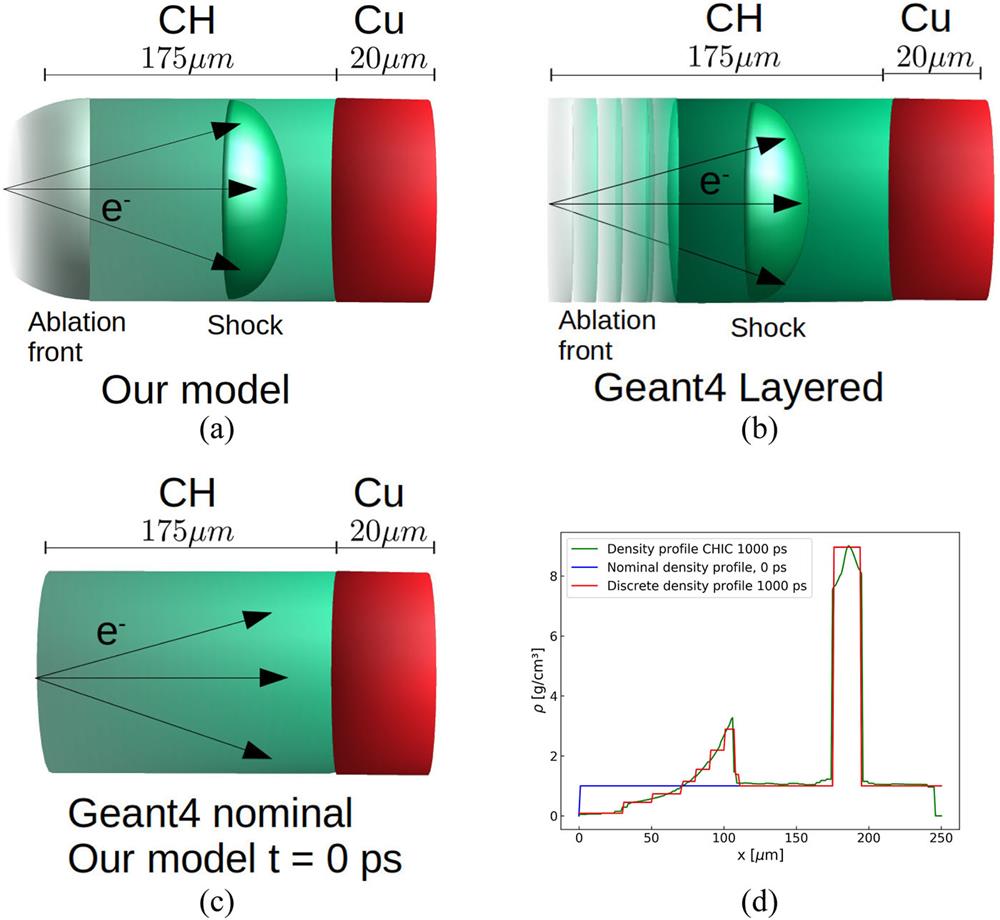
We now study the hot-electron propagation considering the hydrodynamic evolution of the target and its ionization state, and then comparing the results with the Geant4 predictions. For this purpose, target hydrodynamic profiles were extracted from CHIC hydrodynamic simulations at five different times: 0, 250, 500, 750, and 1000 ps. In particular, the electronic temperature, the mass density, and the ion density profiles were extracted from CHIC, and the 2D axisymmetric hydrodynamic quantities were unfolded in 3D space and used as input for the plasma MC code. Simulations were performed by launching electrons at the critical density (launching electrons at nc/4 would not change the result), with an initial spot of 100 µm diameter and a beam divergence of ±22°. Energetically, electrons are assumed to be described by a 2D Maxwellian function with a temperature of 26 keV, which corresponds to the electron distribution function found in the experimental characterization.16 In each simulation, we launched 4 × 10⁶ particles, a number sufficiently large to reduce the numerical error caused by the statistical fluctuation of the observed quantities. Geant4 simulations under similar conditions were also performed with the aim of comparing the Geant4 prediction with the plasma case. The figure of merit chosen to compare the two codes was the electron energy spectrum arriving on the copper plate. This quantity is directly related to the Kα generation, and understanding its behavior for cold and plasma targets, respectively, provides insight into the reliability of the methodology adopted for analyzing these experiments. Except for the case t = 0 ps, we performed three different simulations for each time considered (see Fig. 1):
![]()
Figure 1.Schematic representations of the target configuration used in the simulations performed. (a) Target used in simulations 1 and 2 performed with our MC model. The target configuration is extracted from CHIC simulations at four different times (250, 500, 750, and 1000 ps), and electrons are launched at the critical density. (b) Layered target used in simulation 3 performed with Geant4. The target is composed of several layers with increasing density, to reproduce the ablated and shocked regions. The density profile along the cylinder axis reproduces discretely the profile extracted from CHIC, as shown by the red curve in (d), for the case at 1000 ps. (c) Target used in the nominal Geant4 simulation and in the simulation with our MC code at 0 ps. This target is composed of a CH ablator of thickness 175
For the case t = 0 ps, the target profile extracted from CHIC corresponds to the unablated target configuration (referred to as “nominal simulation”), i.e., a 175 µm, 1 g/cm3 CH ablator followed by the copper plate [the blue curve in Fig. 1(d)]. Evidently, in this case, our MC code works according to the cold model, using the cold stopping power formulas and scattering models (see Paper I17). Figure 2(a) shows a comparison between the electron spectra impinging on the copper plate as predicted by our model at t = 0 ps and by Geant4. These two simulations are equivalent, since both two codes simulate the nominal target configuration in the cold state. As can be seen from the figure, there is very good agreement between the spectra predicted by the two codes. A small difference is seen at low kinetic energies, which is due to the fact that our model does not simulate the secondary electron emission. This good agreement provides evidence for the reliability of our code.
![]()
Figure 2.Spectra of energetic electrons impinging on the copper plate as predicted by the simulations at five different times: (a) 0 ps (cold unablated target); (b) 250 ps; (c) 500 ps; (d) 750 ps; (e) 1000 ps. Electrons described energetically by a 2D Maxwellian function with
The case at 250 ps, shown in Fig. 2(b), is particularly interesting, since it offers a benchmark of the code in the limit of a very small degree of ionization and small density gradient. In fact, the laser pulse has a rise time of 250 ps, and, at this moment, ablation commences, shock waves begin to form, and the material temperature begins to rise. It can be seen from the figure that the simulations with the cold models, i.e., the Geant4 nominal simulation (blue curve), the Geant4 layered simulation (red curve, simulation 3), and our model run in cold mode (black curve, simulation 2) predict the same electron spectrum impinging on the copper plate. When the plasma models are turned on (green curve, simulation 1), the number of electrons reaching the copper plate is slightly lower than in the cold cases. However, the difference is not dramatic, showing that our model converges to the cold limit in the case of small density gradient and degree of ionization. This documents the validity and efficacy of the algorithm adopted to evaluate the mean free path in the presence of materials characterized by density gradients (see Sec. VI of Part I17).
Figures 2(c)–2(e) show the results for the other times (500, 750, and 1000 ps). When the plasma models are turned off (simulation 2, the black curves in Fig. 2), our code predicts a greater number of electrons reaching the copper plate compared with the nominal case (blue curves). This behavior is also confirmed by the Geant4 layered target simulations (simulation 3, red curves in Fig. 2), which agree with our MC method run in cold mode. In particular, the number of hot electrons reaching the copper plate increases as a function of the irradiation time: the more the target is ablated, the fewer electrons are stopped in the ablator and the more reach the copper. This happens because electrons do not experience severe scattering while propagating in the coronal plasma and in the ablated region, owing to the low density of the material. Thus, they tend to retain their directionality for tens of micrometers, until they reach the shocked region. In the shocked region, scattering is more severe, but it is not sufficient to compensate for the fact that electrons have traveled for tens of micrometers without experiencing collisions.
For this reason, the number of electrons that impinge on the copper plate is greater in the ablated targets than in the nominal case. Given this, the 1D hypothesis of ρr conservation seems not to be confirmed by our calculations. However, when the plasma effects are turned on (simulation 1, the green curves in Fig. 2), fewer electrons arrive at the copper. A target in the plasma state absorbs and slows down electrons more effectively compared with the cold case. There are two reasons for this. First, the stopping power in a CH plasma is greater than that in the cold material, as shown by Fig. 3. In particular, the figure shows the value of the stopping power as a function of the electron kinetic energy in cold and in warm (T = 10 eV) polystyrene. The plasma stopping power is greater than in the cold case, in particular for electron energies lower than ∼100 keV, the regime of interest to us (this is expected, since the an electron that moves with high kinetic energy collides and loses energy with other electrons in the medium, regardless of their bound or free state). Another difference between propagation in cold targets and in plasma targets is in the scattering with nuclei. In the cold case, the nuclear potential is screened by the electron cloud of the atom, while in a plasma, the screening is provided by the residual electronic structure and by other plasma particles. In particular, in this regime, the characteristic screening lengths in plasmas are greater than the screening distances of cold atoms. Thus, the effective distances of the nuclear potentials are greater in a plasma, enhancing scattering phenomena and the diffusion of the electron beam, which is prevented from arriving at the copper plate. To explain this more clearly, Fig. 4 shows the electron spectra on the copper plate for the target configuration at 500 ps in two different cases. The green curve is obtained from the plasma simulation presented earlier (simulation 1), in which the nuclear screening is due to the residual electronic structure and to plasma particles [the parameter D = max{λD, ri}, where ri is the average distance between ions, given by Eq. (8) in Paper I17]. The brown curve comes from a simulation in which we forced the screening length to be given by the electronic structure of the atom [the parameter R, given by Eq. (5) in Paper I17]. Both simulations use the plasma stopping power formulas, exploiting the fact that the code separates electron diffusion and energy losses. As can be seen from the figure, when nuclei are screened by their electronic structure, the beam diffusion is lower and the number of electrons reaching the copper plate is greater.
![]()
Figure 3.Stopping power in polystyrene (1.05 g/cm3) as a function of electron kinetic energy in the plasma case with
![]()
Figure 4.Electron spectra impinging on the copper plate predicted by a plasma simulation in which the nuclear potential is screened by the residual electronic structure and other plasma particles (simulation 1, green curve) and a plasma simulation in which the nuclear potential is screened only by the electronic structure (brown curve). The simulations used the target profile extracted from CHIC at 500 ps. As input, electrons were described by a 2D Maxwellian function with
From this analysis, it seems that ρr conservation, commonly invoked to justify the use of cold MC methods to analyze planar target experiments, is not exact. The effect of ρr conservation (i.e., the formation of an ablated and compressed zone) is to increase the number of electrons that impinge on the copper plate, as shown by the red and black curves in Fig. 2. However, this effect is counterbalanced by the fact that the target is in a plasma state and beam diffusion is enhanced.
Let us conclude this subsection by investigating the contribution of the free plasma electrons to beam diffusion. In Sec. II, we stressed that the changes in direction are mainly due to collisions with nuclei, while collisions with electrons are responsible for the energy losses. Figure 5 shows the results of a simulation in which the diffusion on free plasma electrons is neglected (the brown curve), compared with those of the full simulation (the green curve). The target profile used in these simulations was extracted from CHIC at 500 ps. As can be seen, the two spectra are quite similar. This indicates that diffusion on plasma nuclei governs the spatial distribution of the electron beam, while collisions with electrons play a minor role and can be neglected. Therefore, the neglect of diffusion on bound electrons in our model does not introduce any appreciable error.
![]()
Figure 5.Energetic electron spectra impinging on the copper plate predicted by a plasma simulation (simulation 1, green curve) and by a simulation in which the diffusion on plasma electrons is neglected (brown curve). The simulations used the target profile extracted from CHIC at 500 ps. As input, electrons were described by a 2D Maxwellian function with
C. Role of hard collisions and secondary electrons
The implementation of hard collisions requires increases in code complexity and in computational time. As explained in Paper I,17 hard collisions are simulated considering a two-body interaction between the hot electron and a scattering center, using the DCS for the latter. The inclusion of hard collisions requires computation of the collision distances and the use of fictitious particles that propagate before the real electron track (as explained in Sec. VI of Paper I17). This process requires a lot of computational time, jeopardizing the performance of the simulation. However, hard collisions strongly modify the electron spatial distribution and should not be neglected. Figure 6 shows the electron spectra impinging on the copper plate in three cases: a simulation in which hard and soft collisions are simulated (green curve), a simulation in which hard collisions are neglected (brown curve) and a simulation in which electrons propagate along straight lines, slowing down according to the stopping power formulas (violet curve). These spectra were obtained using as input an electron Maxwellian distribution function with temperature 26 keV, analogously to the previous cases. The target simulated was extracted from the CHIC simulation at 500 ps. As can be seen, there are significant differences between the three cases. When beam diffusion is completely neglected, the number of hot electrons arriving on the copper plate is ∼3.5 times greater than in the nominal simulation, whereas when hard collisions alone are neglected, there are twice as many electrons arriving. The dramatic differences in the spectra in Fig. 6 indicate that in this regime, it is not possible to neglect either beam diffusion or hard collisions.
![]()
Figure 6.Electron spectra impinging on the copper plate with both hard and soft collisions considered (green curve), with hard collisions neglected (brown curve), and with beam diffusion neglected, i.e., with electrons propagating along straight lines (violet curve). The input spectrum was a Maxwellian function with
Figure 7 shows the spectrum of secondary electrons generated by hard collisions that reach the copper plate (black curve). These electrons are generated by the hard collisions of the primary particles with the electrons of the material. It can be seen that secondary electrons are characterized by low values of the kinetic energy and their number is low compared with the total number of electrons reaching the copper plate. Thus, the fact that we do not simulate the generation and propagation of secondary electrons in our model does not introduce any appreciable error.
![]()
Figure 7.Electron spectra impinging on the copper plate with both primary and secondary particles (blue curve) and with only secondary electrons considered (black curve) according to Geant4 simulations. The input spectrum was a Maxwellian function with
D. Reinterpretation of the OMEGA experiment using the plasma MC method: How the Kα yield changes when cold or irradiated targets are considered
Let us now reconsider the analysis of the Kα spectrometer presented in Ref. 16. In this experiment, the total yield of Cu Kα was measured by an absolutely calibrated zinc von Hamos x-ray (ZnVH) spectrometer,39 based on a curved highly oriented pyrolytic graphite (HOPG) crystal in von Hamos geometry to disperse the x-ray spectrum in the range of 7–10 keV. To reconstruct the number of Kα photons that reached the diagnostic, Geant4 simulations of hot-electron propagation in targets were performed. In particular, monochromatic electron beams were injected in the target and the parameters Ne and Th of a 2D electron Maxwellian function that generated the Kα signal on the diagnostic were retrieved. The target configuration used in these simulations was the nominal one (175 µm CH, 20 µm Cu). These simulations are performed again here, but using the plasma MC code and now taking into account the hydrodynamic evolution and the plasma state of the target. Since Kα generation is not modeled in our plasma MC code, we compute the electron spectra that reach the copper plate and we use these spectra as input in Geant4, to compute the Kα signal.
The cross sections used to compute the Kα de-excitation are contained in the library Livermore.40 We recall that in Ref. 16, the library Penelope41 was also used and revealed a ∼25% discrepancy in the Kα yield compared with Livermore. The temporal evolution of the system is reproduced by weighting the signal of the plasma simulations according to the backscattered light signal detected by a streaked subaperture backscattering spectrometer (SABS). This spectrometer diagnosed the temporally resolved spectrum of the SRS backscattered light (430–750 nm). We are thus assuming that hot electrons are produced by SRS. Figure 8 shows the values of the parameters Ne and Th that reproduce the Kα signal on the ZNVH spectrometer for the nominal Geant4 simulation and the plasma simulation. The discrepancies between the two cases are less than 5% and 30% for Th and Ne, respectively, as indicated by the error bars. As the plasma target stops electrons more effectively compared with the cold case, it is reasonable that higher values of Th and Ne are required to obtain the same Kα yield. However, the discrepancy between the cold and plasma cases is not dramatic and is similar to that found in simulations using the two libraries Livermore and Penelope. Thus, considering also the experimental uncertainty in Kα detection (∼20%), we can conclude that it is acceptable to use a cold MC method to interpret laser–plasma experiments, at least in the simulation of Kα generation.
![]()
Figure 8.Parameters
IV. EFFECT OF HOT ELECTRONS ON A TYPICAL IMPLOSION SCHEME
We describe here a numerical study conducted with our 3D plasma MC method on the effect of hot electrons on a typical SI implosion scheme. We consider, in particular, the scheme proposed in the numerical study of Ref. 19. This numerical investigation was conducted using the 2D hydrodynamic code CHIC.20 In particular, the authors simulated the implosion of an SI capsule composed of a 31 µm CH ablator(1.05 g/cm3) containing a 220 µm DT shell (0.253 g/cm3) in equilibrium with 737 µm of DT gas (10−4 g/cm3). The laser pulse used to implode this target is shown in Fig. 9(a) and consists of a low-intensity precompression beam followed by a 1 ns high-intensity spike launched at 13.6 ns. The total energy delivered on the capsule is ∼350 kJ, and the energy contained in the spike is ∼290 kJ. CHIC computes the characteristics of the hot-electron beam generated during the interaction according to scaling laws that account for the local laser–plasma conditions.42 Notably, during the spike, the code predicted the generation of a two-temperature electron distribution function characterized by Th1 = 43 keV, η1 = 1.2% and Th2 = 98 keV, η2 = 0.94%. Here, η is the conversion efficiency of laser energy into hot-electron energy. Hot electrons are transported through the target in a simplified 2D propagation model that accounts for beam slowing down and diffusion on plasma particles. The figure of merit chosen to evaluate the DT shell preheating induced by hot electrons is the shell adiabat, which is defined as the ratio of the plasma pressure to the Fermi pressure of a degenerate electron gas:43
![]()
Figure 9.(a) Laser pulse used to implode the capsule. The pulse consists of a low-intensity compression beam followed by a high-intensity spike launched at 13.6 ns. The spike has duration of 1 ns. The total energy contained in the beam is around ∼350 kJ. (b) Schematic of the setup for the MC simulation and the geometric characteristics of the hot-electron beam.
Since our MC model has not yet been implemented in hydrodynamic codes, we performed offline simulations in which target hydrodynamic profiles were extracted from CHIC simulations. From these profiles, exploiting the spherical symmetry of the problem, 3D targets were generated. Because of the decoupling between the two codes, it was not possible to evaluate the hot-electron effect on the hydrodynamic evolution of the target. Our analysis is limited to computing the energy deposition in the inner part of DT shell and in evaluating the consequent increase in the adiabat, according to the perfect gas model. Since we are interested in the preheating of the inner part of the DT shell, the value of the adiabat in this region (αinn) is computed considering the minimum of the adiabat along the shell radius, as shown in Fig. 10 for the simulation at 13.6 ns.
![]()
Figure 10.Adiabat as a function of shell radius, computed from the CHIC simulation at 13.6 ns. The positions of the shock front, the inner part of the shell, and the hotspot are indicated by the black, red, and green curves, respectively.
In the simulations, the hot-electron beam is launched at the critical density (launching it at nc/4 does not change the result) in two configurations: one with a circular spot of diameter S = 1580 µm diameter (∼80% of the initial target radius) and an initial beam divergence of 0°, ±22°, or ±45°, and the other with a circular spot of S = 720 µm diameter (the dimension of the capsule at the shock launching time) and an initial beam divergence of 0°. The parameters in the second case are less realistic, but this allows us to consider the worst-case scenario, maximizing the number of hot electrons initially directed toward the capsule. A schematic representation of the settings of the first simulation is shown in Fig. 9(b).
The electrons launched in the simulations are energetically described by 2D Maxwellian functions with different temperatures and conversion efficiencies with respect to the total spike energy. In particular, we consider the parameters found in the experiment presented in Ref. 16 (fe1 with Th = 26 keV, η = 11%) and those used in Ref. 19 (fe2 with Th = 43 keV, η1 = 1.2% and Th = 98 keV, η2 = 0.94%). These values are listed in Table I.
The shell adiabat was calculated as follows. The laser spike duration was divided in four steps of 250 ps each, and an MC simulation was conducted at each step, using the corresponding hydrodynamic profile. In each simulation, an electron beam was launched whose energy was calculated in relation to the spike energy delivered on the target in the time windows selected (250 ps), using the parameters indicated in Table I. To reduce the computational time, simulations were conducted by launching 106 particles and then rescaling the values, using the real laser energies and conversion efficiencies. This low number of particles is sufficient to reduce the statistical noise and numerical error in the quantities considered. The volumetric energy deposition in concentric spherical shells with thickness ∼5–10 µm, eHE, was thereby computed. The additional pressure induced by hot electrons was then estimated using the law for a perfect diatomic gas:
| Distribution function | fe1 | fe2 |
|---|---|---|
| Th (keV) | 26 | 43–98 |
| η (%) | 11 | 1.2–0.94 |
| αinn (S = 1580 µm, Div = 0°) | 1.8 | 2.2 |
| αinn (S = 1580 µm, Div = ±22°) | 1.8 | 2.1 |
| αinn (S = 1580 µm, Div = ±45°) | 1.8 | 2.1 |
| αinn (S = 720 µm, Div = 0°) | 1.8 | 2.7 |
| αinn (Ref. | ⋯ | 2.3 |
Table 1. Hot-electron temperatures Th and laser to hot-electron conversion efficiencies η used as input in the simulations. The values of Th are based on the experimental findings in Ref.
The values of αinn before shock convergence (after 14.35 ns) are shown in Table I for all the beam geometries considered. First of all, it can be seen that the simulations with fe1 (Th = 26 keV, η = 11%) do not predict a significant increase in αinn, which goes from 1.7 up to 1.8, for any of the considered geometries. This is due to the fact that the electrons are characterized by low values of kinetic energy and they do not penetrate the compressed region. Conversely, the simulations with fe2 (Th1 = 43 keV, η1 = 1.2% and Th2 = 98 keV, η2 = 0.94%) predict greater values of αinn. In particular, for the geometrical configuration with S = 1580 µm, αinn rises to ∼2.1–2.2. Here, it can be seen that αinn exhibits a weak dependence on the initial beam divergence. For the other geometrical configuration (S = 720 µm, Div = 0°), αinn rises to . This is expected, since in this case all the electrons produced are directed into the target. Moreover, in the case of fe2, hot electrons are characterized by high values of kinetic energy and they can penetrate the compressed region, reaching the DT shell. This can be seen in Fig. 11, where the hot-electron energy deposition and the target density profiles are shown as functions of the sphere radius at two different times (13.6 and 14.35 ns). The red curves represent the target density profile along the shell radius, from which it is possible to recognize the shocked region identified by the maximum of the function (around 10 g/cm3 at 13.6 ns and 40 g/cm3 at 14.35 ns). The hot-electron energy deposition is represented by the blue curves. From these, it can be seen that in the case of fe1, both at 13.6 and at 14.35 ns, the majority of hot electrons are stopped in the shocked region. By contrast, in the case of fe2, at 13.6 ns, the compressed part of the capsule has not yet reached a sufficiently high value of ρr to stop the hot-electron population at Th = 98 keV, which can propagate up to the inner part of the DT shell. This causes a preheating effect, raising the shell adiabat at ∼2.1 (or 2.7 for the beam geometry with S = 720 µm and Div = 0°). At 14.35 ns, for both fe1 and fe2, the target ρr is sufficient to stop the electrons. Thus, in the design of SI implosion schemes, to avoid DT-shell preheating, one should ensure that the capsule has been compressed sufficiently before the ignition spike is launched. This is consistent with recent OMEGA experiments,13 in which ρr degradation was evaluated as a function of the spike launch time. Finally, it should be noted that the values of αinn found in our calculation do not differ dramatically from the value of 2.3 computed in Ref. 19.
![]()
Figure 11.Volumetric energy deposition along the capsule radius (blue curves) and density profile of the imploding capsule as a function of capsule radius (red curves). The capsule center is at
Let us now consider the first simulation setup (22° beam divergence and 1580 µm diameter spot) to evaluate the variation of the shell adiabat for various values of the parameters η and Th. In particular, we performed several simulations in which Th was varied from 20 keV up to 150 keV and η from 1% up to 20% (considering the laser spike energy). Figure 12 shows the inner shell adiabat αinn as a function of the parameters η and Th. The red line delimits the region of the map in which αinn ≤ 1.8, while the green line delimits the region in which αinn ≤ 2.3. The condition αinn ≤ 1.8 is the strictest condition and minimizes the preheating effect. The condition α = 2.3 is chosen because this level of preheating leads to ignition failure, as predicted in Ref. 19. To evaluate the actual level of preheating that can be tolerated by the scheme, it will be necessary to conduct inline 3D hydrodynamic simulations in which the effects of the hot electrons on shock propagation and the hydrodynamic evolution of the capsule are taken into account. It can be seen that the scheme is able to tolerate hot-electron temperatures up to ∼25–30 keV, even at high conversion efficiencies (∼10%). Hot electrons with temperatures in the range Th ∈ [30, 50] keV should be limited to a few percent of the spike energy, while the population with Th > 50 keV should be suppressed. Thus, the hot-electron characteristics observed experimentally in the experiments conducted at OMEGA-EP16 and LMJ15,44,45 are compatible with the scheme. However, one should pay attention to the possible presence of higher hot-electron temperature populations not detected by the diagnostics. Experimentally, there are difficulties in the characterization of hot-electron populations characterized by high temperatures ( keV) and low intensity, which can pose a problem for the success of the implosion.
![]()
Figure 12.Inner shell adiabat
V. CONCLUSION
This paper has described two applications of a 3D Monte-Carlo code developed to model hot-electron transport in fusion targets. In contrast to common MC methods (e.g., Geant4), this model simulates hot-electron propagation in ionized or partially ionized targets, taking into account the presence of the plasma state. Hot electrons lose energy during their propagation, colliding with other free or bound electrons and exciting plasma waves. The beam diffusion is governed mainly by elastic collisions with nuclei. Changes in direction due to collisions with free plasma electrons are also modeled in the code, while those due to collisions with bound electrons are neglected. Beam diffusion is modeled considering hard and soft collisions, as explained in Paper I.17
In the first part of this paper, we studied hot-electron propagation in laser-irradiated planar targets, comparing the results with the cold case (i.e., an nonirradiated unablated target under standard conditions). This is useful, because it provides a better understanding of the margin of error introduced in the interpretation of laser–plasma experiments by the use of cold MC methods, which do not account for the presence of the plasma state or the hydrodynamic evolution of the target. Compared with the cold case, a plasma is more effective in absorbing and stopping hot electrons. This is due in part to the increased stopping power of plasma targets and in part to the different nature of the electron–nucleus collisions. In particular, in cold targets, electrons scatter with nuclei screened by their electronic structure, while in a plasma, the screening is due to residual bound electrons and to other plasma particles. Therefore, the nuclear potential in plasmas has a greater range than in the cold case, leading to enhanced beam diffusion. However, this effect is partially counterbalanced by the presence of the ablation region, a low-density region in which electrons do not undergo severe scattering and the beam remains collimated. Owing to the competition between these two effects, hot-electron propagation does not differ dramatically between cold and laser-irradiated targets, and the interpretation of laser–plasma experiments based on cold MC methods can be considered correct, at least to first order. Using the same setup, we also performed a simulation showing that the diffusion of the electron beam is governed mainly by elastic collisions with nuclei, with scattering on electrons playing only a minor role. Thus, neglecting the changes in direction due to collisions with bound electrons will not introduce any substantial error in the model. Finally, we showed that in this regime, hard collisions should not be neglected. This is expected, since the bulk of a laser-irradiated target is a strongly coupled plasma at high density, characterized by low values of the Coulomb logarithm.
In the second part of the paper, we described a numerical investigation aimed at evaluating the preheating effect of hot electrons on a typical SI implosion scheme. The hot-electron energy deposition in the inner part of the DT shell was computed for different hot-electron characteristics (beam divergence, temperature, and conversion efficiencies with respect to the laser energy). The study showed that low hot-electron temperatures (25–30 keV) do not give rise to any preheating concern, even at high conversion efficiencies. However, the presence of electrons at temperatures around 30–40 keV should be limited to a few percent of the laser energy, while hot-electron populations with temperatures greater than 50 keV should be suppressed. These results seem not to be strongly influenced by the different beam divergences set in the simulations. Furthermore, these conditions on the temperature and the conversion efficiency appear compatible with hot-electron spectra measured experimentally under SI-relevant conditions. However, great care should be taken here, since high-temperature hot-electron populations are notoriously hard to detect accurately in these experiments, and their potential presence cannot be excluded.
ACKNOWLEDGMENTS
Acknowledgment. This work has been carried out within the framework of the EUROfusion Enabling Research Project No. AWP17-ENR-IFE-CEA-01 “Preparation and Realization of European Shock Ignition Experiments” and has received funding from the Euratom Research and Training Program 2014–2018 under Grant Agreement No. 633053. The views and opinions expressed herein do not necessarily reflect those of the European Commission.
The authors thank Professors Vladimir Tikhonchuk and Stefano Atzeni for many useful discussions. We also thank the anonymous reviewers for their constructive comments.
References
[1] J.Nuckolls, G.Zimmerman, L.Wood, A.Thiessen. Laser compression of matter to super high densities: Thermonuclear (CTR) applications. Nature, 239, 139-142(1972).
[2] N. G.Basov, G. V.Sklizkov, O. N.Krokhin. Heating of laser plasmas for thermonuclear fusion. Laser Interact. Relat. Plasma Phenom., 2, 398(1972).
[3] V. A.Shcherbakov. Ignition of a laser fusion target by a focusing shock wave. Sov. J. Plasma Phys, 9, 240(1983).
[4] C. D.Zhou, W.Theobald, A. A.Solodov, R.Betti, L. J.Perkins, K. S.Anderson. Shock ignition of thermonuclear fuel with high areal density. Phys. Rev. Lett., 98, 155001(2007).
[5] G.Schurtz, B.Canaud, S.Atzeni, A. J.Schmitt, X.Ribeyre, L. J.Perkins, R.Betti. Shock ignition of thermonuclear fuel: Principles and modelling. Nucl. Fusion, 54, 054008(2014).
[6] B. B.Afeyan, E. A.Williams. Stimulated Raman sidescattering with the effects of oblique incidence. Phys. Fluids, 28, 3397-3408(1985).
[7] M. N.Rosenbluth, C. S.Liu. Parametric decay of electromagnetic waves into two plasmons and its consequences. Phys. Fluids, 19, 967-971(1976).
[8] W. L.Kruer. The Physics of Laser Plasma Interactions Reprint(2003).
[9] S.Borodziuk, M.Kalal, T.Pisarczyk, E.Krousky, A.Kasperczuk, M.Pfeifer, J.Skala, B.Kralikova, J.Limpouch, K.Masek, S.Guskov, K.Rohlena. Generation of shock waves and formation of craters in a solid material irradiated by a short laser pulse. Quantum Electron., 34, 989-1003(2004).
[10] S.Gus’kov, X.Ribeyre, V.Tikhonchuk, J.-L.Feugeas, P.Nicola?, M.Touati. Ablation pressure driven by an energetic electron beam in a dense plasma. Phys. Rev. Lett., 109, 255004(2012).
[11] A.Kasperczuk, T.Chodukowski, S. Y.Guskov, Z.Kalinowska, T.Pisarczyk, O.Renner, E.Krousky, N.Demchenko, M.Smid, M.Pfeiferet?al.. Laser-driven ablation through fast electrons in PALS-experiment at the laser radiation intensity of 1–50 PW/cm2. Laser Part. Beams, 32, 177-195(2014).
[12] V.Tikhonchuk, F.Barbato, J.Feugeas, G.Boutoux, L.Antonelli, D.Batani, D.Mancelli, J.Santos, G.Folpini, A.Colaitiset?al.. Progress in understanding the role of hot electrons for the shock ignition approach to inertial confinement fusion. Nucl. Fusion, 59, 032012(2018).
[13] J. A.Frenje, A.Casner, R.Betti, J.Trela, W.Theobald, J. A.Delettrez, X.Ribeyre, K. S.Anderson, V. Y.Glebov, D.Bataniet?al.. The control of hot-electron preheat in shock-ignition implosions. Phys. Plasmas, 25, 052707(2018).
[14] L.Antonelli, D.Mancelli, A.Tentori, J.Trela, P.Nicola?, D.Batani, V.Tikhonchuk, G.Boutoux, F.Barbato, S.Atzeni. Laser-driven strong shocks with infrared lasers at intensity of 1016 W/cm2. Phys. Plasmas, 26, 112708(2019).
[15] L.Jacquet, A.Casner, G.Boutoux, S.Brygoo, C.Rousseaux, E. L.Bel, S. D.Baton, M.Koenig, D.Batani, A.Cola?tis et al. Preliminary results from the LMJ-PETAL experiment on hot electrons characterization in the context of shock ignition. High Energy Density Phys, 36, 100796(2020).
[16] K.Anderson, E.Le Bel, A.Casner, D.Raffestin, W.Theobald, M.Wei, A.Tentori, J.Trela, A.Ruocco, A.Colaitiset?al.. Experimental characterization of hot-electron emission and shock dynamics in the context of the shock ignition approach to inertial confinement fusion. Phys. Plasmas, 28, 103302(2021).
[17] D.Tentori, A.Cola?tis, A.Batani. 3D Monte-Carlo model to study the transport of hot electrons in the context of inertial confinement fusion: Part I. Matter Radiat. Extremes, 7, 065902(2022).
[18] J.Allison, H.Araujo, D.Axen, G.Barrand, M.Asai, K.Amako, J.Apostolakis, S.Agostinelli, P.Arce, S.Banerjeeet?al.. Geant4—A simulation toolkit. Nucl. Instrum. Methods Phys. Res., Sect. A, 506, 250-303(2003).
[19] X.Ribeyre, A.Cola?tis, P.Nicola?, G.Duchateau, V.Tikhonchuk, E.Le Bel. Influence of laser induced hot electrons on the threshold for shock ignition of fusion reactions. Phys. Plasmas, 23, 072703(2016).
[20] P.-H.Maire, J.Breil, S.Galera. Multi-material ALE computation in inertial confinement fusion code CHIC. Comput. Fluids, 46, 161(2011).
[21] C.Moller. Zur theorie des durchgangs schneller elektronen durch materie. Ann. Phys., 406, 531-585(1932).
[22] R. H.Dalitz, R. E.Peierls. On higher born approximations in potential scattering. Proc. R. Soc. London, Ser. A, 206, 509-520(1951).
[23] J. R.Davies, A.Schiavi, S.Atzeni. Stopping and scattering of relativistic electron beams in dense plasmas and requirements for fast ignition. Plasma Phys. Controlled Fusion, 51, 015016(2008).
[24] D. C.Joy. Monte Carlo Modeling for Electron Microscopy and Microanalysis(1995).
[25] P.Andreo, A.Brahme. Restricted energy-loss straggling and multiple scattering of electrons in mixed Monte Carlo procedures. Radiat. Res., 100, 16-29(1984).
[26] K.Heinrich, E. R.Krefting, L.Reimer, D. N. H.Yakowitz. The effect of scattering models on the results of Monte Carlo calculations. Use of Monte Carlo Calculations in Electron Probe Microanalysis and Scanning Electron Microscopy, 45-60(1976).
[27] J. M.Fernández-Varea, R.Mayol, J.Baró, F.Salvat. On the theory and simulation of multiple elastic scattering of electrons. Nucl. Instrum. Methods Phys. Res., Sect. B, 73, 447-473(1993).
[28] PENELOPE 2018: A code system for Monte Carlo simulation of electronand photon transport(2019).
[29] S.Goudsmit, J. L.Saunderson. Multiple scattering of electrons. Phys. Rev., 57, 24-29(1940).
[30] J. L.Saunderson, S.Goudsmit. Multiple scattering of electrons. II. Phys. Rev., 58, 36-42(1940).
[31] H. W.Lewis. Multiple scattering in an infinite medium. Phys. Rev., 78, 526-529(1950).
[32] A. A.Solodov, R.Betti. Stopping power and range of energetic electrons in dense plasmas of fast-ignition fusion targets. Phys. Plasmas, 15, 042707(2008).
[33] J. D.Jackson. Classical Electrodynamics(1975).
[34] R. M.More. Processes in non ideal plasmas, 135-215(1986).
[35] G.Wentzel. Zwei Bemerkungen über die Zerstreuung korpuskularer Strahlen als Beugungserscheinung. Z. Phys., 40, 590-593(1926).
[36] J. A.Dennis, H. H.Anderson, D.Powers, M. J.Berger, J. E.Turner, M.Inokuti, H.Bichsel, S. M.Seltzer. Report 37.
[38] M.?míd, L.Antonelli, O.Renner, D.Batani. Suprathermal electron production in laser-irradiated Cu targets characterized by combined methods of x-ray imaging and spectroscopy. Plasma Phys. Controlled Fusion, 58, 075007(2016).
[39] C.McGuffey, P. K.Patel, S. H.Glenzer, F. N.Beg, H.Sawada, T.D?ppner, O. L.Landen, C.Stoeckl, H. S.McLean, L. C.Jarrott, R. B.Stephens, C.Sorce, M. S.Wei, W.Theoboald, P. M.Nilson. Calibration and characterization of a highly efficient spectrometer in von Hamos geometry for 7-10 keV x-rays. Rev. Sci. Instrum., 88, 043110(2017).
[40] D. E.Cullen, M. H.Chen, J.Rathkopf, J. H.Hubbell, J.Scofield, S. T.Perkins. Tables and graphs of atomic subshell and relaxation data derived from the LLNL evaluated atomic data library (EADL), Z = 1–100(1991).
[41] X.Llovet, F.Salvat, C. J.Powell, A.Jablonski. Cross sections for inner-shell ionization by electron impact. J. Phys. Chem. Ref. Data, 43, 013102(2014).
[42] P.Nicola?, A.Cola?tis, D.Batani, G.Duchateau, V.Tikhonchuk, L.Antonelli, X.Ribeyre, G.Boutoux, Y.Maheut. Coupled hydrodynamic model for laser-plasma interaction and hot electron generation. Phys. Rev. E, 92, 041101(2015).
[43] C. D.Zhou, R.Betti. Hydrodynamic relations for direct-drive fast-ignition and conventional inertial confinement fusion implosions. Phys. Plasmas, 14, 072703(2007).
[44] L. A.Gizzi, L.Labate, S.Baton, P.Koester, A.Cola?tis, A.Casner, F.Baffigi, D.Batani, M.Koenig, G.Cristoforettiet?al.. Bremsstrahlung cannon design for shock ignition relevant regime. Rev. Sci. Instrum., 92, 013501(2021).
[45] A.Tentori. Experimental and theoretical study of hot electrons in the context of the shock ignition approach to inertial confinement fusion(2022).

Set citation alerts for the article
Please enter your email address
© Copyright 2018-2021 | Chinese Laser Press. All Rights Reserved 沪ICP备15018463号-20