
Wei Gong, Chengzhi Xiang, Feiyue Mao, Xin Ma, Ailin Liang, "Wavelet modulus maxima method for on-line wavelength location of pulsed lidar in CO2 differential absorption lidar detection," Photonics Res. 4, 0074 (2016)
- Photonics Research
- Vol. 4, Issue 2, 0074 (2016)
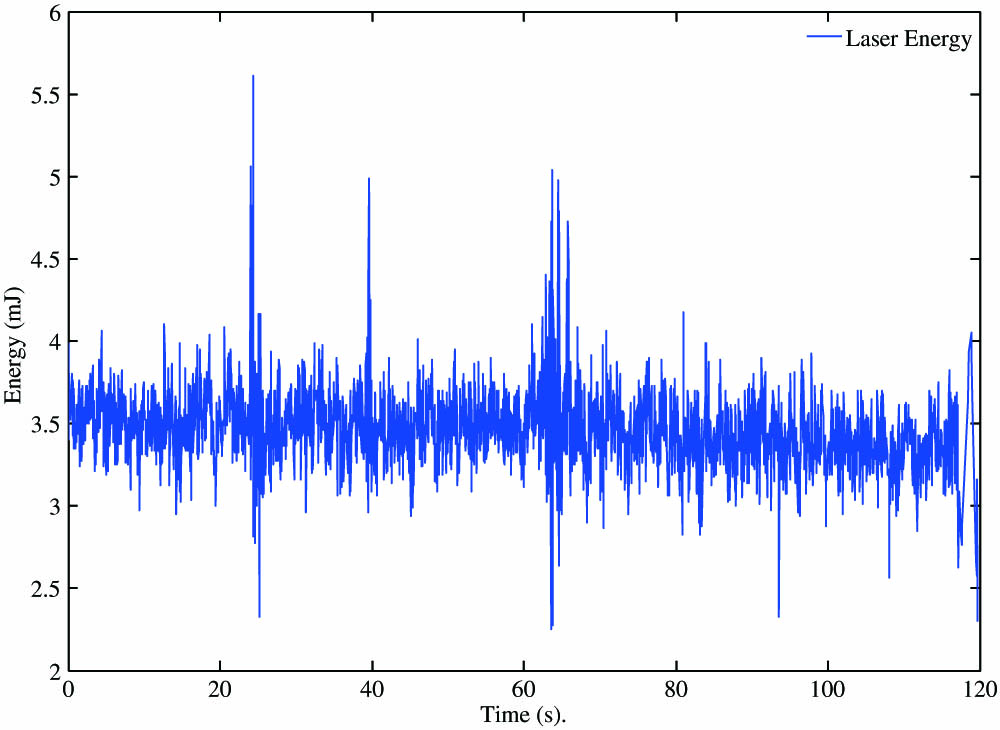
Fig. 1. Fluctuation of the dye laser emission system at around 1.6 μm region.
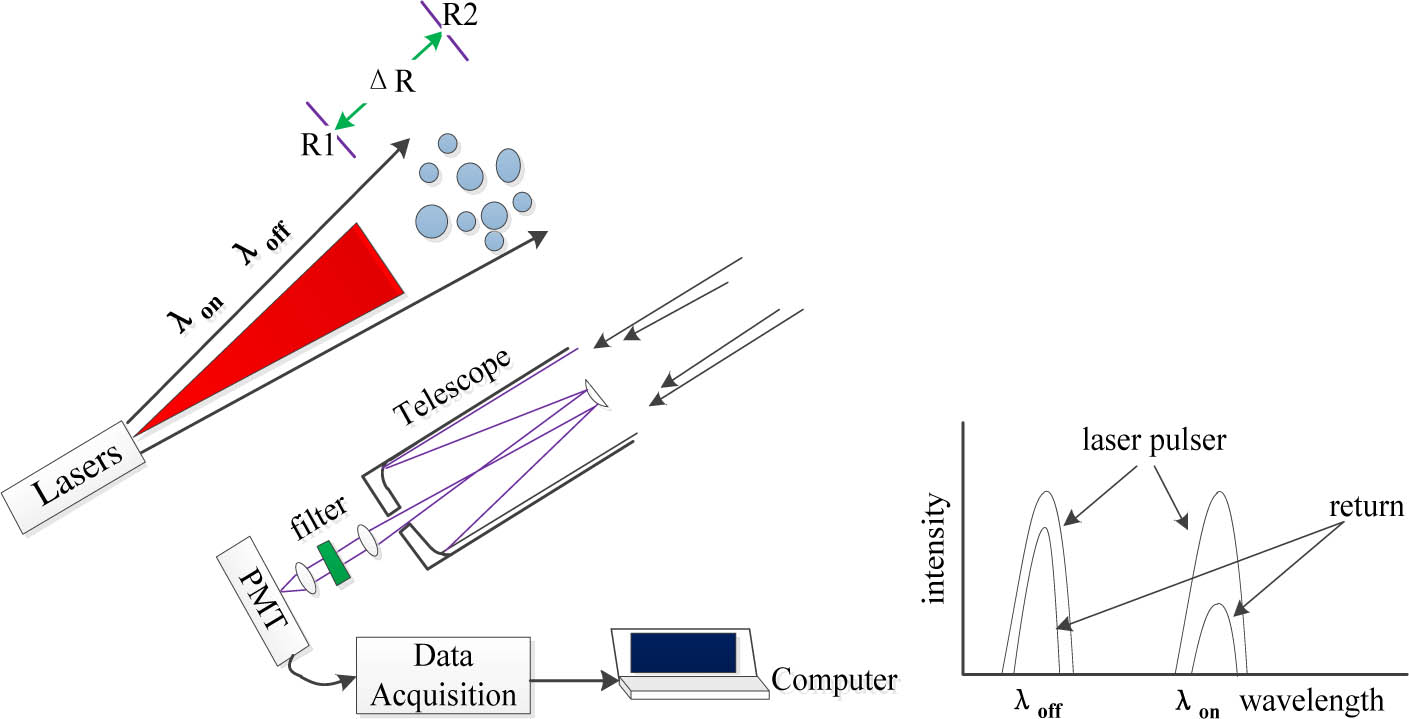
Fig. 2. Diagram of the ground-based DIAL.
Fig. 3. Simultaneous emission system of the dual-wavelength laser.
Fig. 4. Calculated absorption cross sections of CO 2 H 2 O
Fig. 5. Calculated absorption cross sections of the CO 2
Fig. 6. Simulated result of on-line wavelength calibration through the wavelet modulus maxima in R16.
Fig. 7. Simulated result of on-line wavelength calibration through quintic polynomial fitting in R16.
Fig. 8. Calibration result of the wavelet modulus maxima and polynomial fitting method with an SNR of 20.
Fig. 9. Calibration result of the wavelet modulus maxima and polynomial fitting method with an SNR of 80.
Fig. 10. Calibration result of the wavelet modulus maxima and polynomial fitting method with an SNR of 50.
Fig. 11. Calibration result of the wavelet modulus maxima and polynomial fitting method with an SNR of 30.
Fig. 12. Calibration result of the wavelet modulus maxima and polynomial fitting method with an SNR of 10.
Fig. 13. Calibration result of the wavelet modulus maxima and polynomial fitting method with an SNR of 5.
Fig. 14. Calibration result of the wavelet modulus maxima and polynomial fitting method with an SNR of 1.
Fig. 15. Wavelength control unit of the ground-based DIAL.
Fig. 16. Result of on-line wavelength calibration with real measured signals through the wavelet modulus maxima at the R16 region.
|
Table 1. Spectroscopic Parameters of CO 2 H 2 O
|
Table 2. Statistical Result of the 100 Simulated Experiments Through the Wavelet Modulus Maxima
|
Table 3. Statistical Result of the 100 Simulated Experiments Through Quintic Polynomial Fitting
| |||||||||||||||||||||||||||||||||||||||
Table 4. Statistical Calibration Results of the Simulated Signals Through Two Methods with Different SNRs
|
Table 5. Evolution of On-Line Wavelength Calibration Through the Wavelet Modulus Maxima (unit: nm)


Set citation alerts for the article
Please enter your email address

© Copyright 2018-2021 | Chinese Laser Press. All Rights Reserved 沪ICP备15018463号-20