Differential absorption lidar (DIAL) is an excellent technology for atmospheric CO2 detection. However, the accuracy and stability of a transmitted on-line wavelength are strictly required in a DIAL system. The fluctuation of a tunable pulsed laser system is relatively more serious than that of other laser sources, and this condition leads to a large measurement error for the lidar signal. These concerns pose a significant challenge in on-line wavelength calibration. This study proposes an alternative method based on wavelet modulus maxima for the accurate on-line wavelength calibration of a pulsed laser. Because of the different propagation characteristics of the wavelet transform modulus maxima between signal and noise, the singularities of a signal can be obtained by detection of the local modulus maxima in the wavelet transform maximum at fine scales. Simulated analysis shows that the method is more accurate than the general method such as quintic polynomial fitting and can steadily maintain high calibration precision at different signal-to-noise ratios (SNRs). Last, 16 groups of real experiments were conducted to verify the simulated analysis, which shows that the proposed method is an alternative for accurately calibrating an on-line wavelength. In addition, the proposed method is able to suppress noises in the process of wavelength calibration, which gives it an advantage in accurate on-line wavelength calibration with a low SNR.Research Funds for the Central Universities (2042015kf0015).
Atmospheric is considered the largest anthropogenic forcing function for climate change because it is closely related to human activities [1]. The concentration of has increased from approximately 280 ppm () to 400 ppm since the Industrial Revolution, the major result of which has been directly modified by human activities [2,3]. Previous studies have shown that the natural geographic distribution and temporal variability of sources and sinks are not yet properly understood, and considerable uncertainty about the global budget remains [4–6]. Accurate knowledge of the spatial and temporal distributions of and an understanding of their cause are essential to make a good prediction of the behavior of exchange between lands and oceans as well as the effect of this behavior on climate change.
To address these issues, several systems have been developed to explore atmospheric with different techniques. Passive instruments, such as GOSAT and OCO-2, use spectroscopy of reflected near-infrared sunlight to retrieve the total column abundance [7,8]. Differential absorption lidar (DIAL) is also an important means of detection with many advantages, such as diurnal coverage, less interference from clouds and aerosol scattering, and precise column height determination. DIAL not only measures the total amount of but also provides vertical profiles of concentration distribution as well as conducts continuous time and space observations [9–13]. However, DIAL systems are complex and have high technical requirements for atmospheric measurements. Tans et al.[14] proposed that atmospheric measurements should have a high resolution, with approximately 0.3% precision, to be useful in reducing uncertainties about carbon sources and sinks. Consequently, stringent wavelength accuracy and stability are required.
Numerous groups have focused on the calibration of on-line wavelengths, and a series of on-line wavelength calibration systems that significantly improve the detection precision of DIAL have been designed [15–17]. However, most of them are continuous-wavelength (CW) modulation systems, and on-line wavelength calibration is achieved by the calibration of a CW injection seed laser under the assumption that the wavelength of the output laser can be precisely controlled by the injection seed process [18]. Until recently, limited knowledge has been available for the on-line wavelength calibration of pulsed lidar. Our group intends to develop a ground-based DIAL system using pulsed lidar for atmospheric sensing, with a dye laser used as a tunable frequency converter to generate the desired wavelengths.
Sign up for Photonics Research TOC. Get the latest issue of Photonics Research delivered right to you!Sign up now
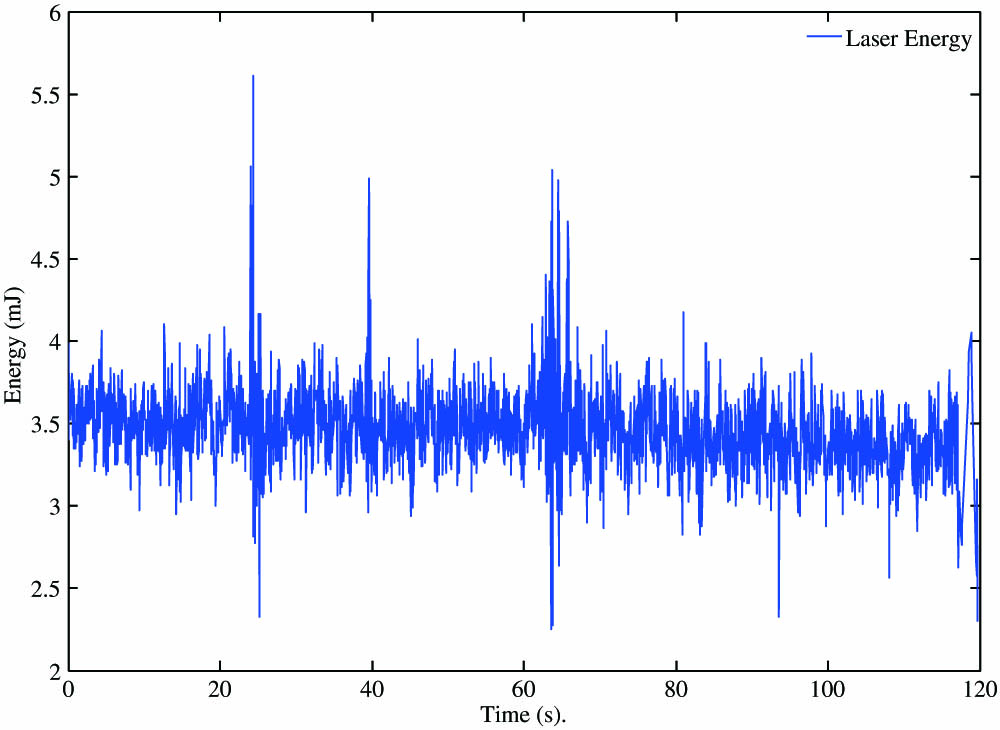
Dye laser, characterized by its mature mechanics and high stability to obtain infrared laser with a narrow linewidth, is a good choice for tunable laser sources of pulsed lidar to build global multipoint networks. With future development of laser technology, an optical parametric oscillator (OPO) with seed injection may be a better choice to obtain an infrared laser with a narrow linewidth. However, at present, a dye laser is a more feasible and reasonable scheme [19,20]. However, the fluctuation of the laser emission system, which takes the dye laser as its source, is serious, approximately 10% at around 1.6 μm, as shown in Fig. 1. Some methods have been studied in reducing the influence caused by the fluctuation of dye laser [21]. Nevertheless, the influences of other parameters, such as the noise of an infrared detector, will also cause some errors in the calibration of an on-line wavelength. The on-line wavelength calibration of dye laser emission system is also affected by the backlash error of the tunable laser, and this condition generates large errors as it conducts the wavelength adjustment through mechanical rotation [22]. The calibration of on-line wavelength should be more stringent to achieve accurate detection of atmospheric by the DIAL of pulsed laser; otherwise, huge influences will be encountered and cause an incorrect inversion result.
Figure 1.Fluctuation of the dye laser emission system at around 1.6 μm region.
In this study, a method for the accurate on-line wavelength calibration of a pulsed lidar is proposed. The method is based on wavelet modulus maxima and achieved by wavelet packet analysis. As an important parameter of wavelet transform, a wavelet modulus maxima plays a vital role in the detection of singular points [23,24]. The influence of noise is small in the singularity detection of signals, as the wavelet transform modulus maxima of various scales have different propagation characteristics between the signal and noise, which makes the approach suitable for a fine calibration for on-line wavelength combined with the coarse calibration by a wave meter.
The principle and laser emission system of DIAL is described in Section 2. Relevant knowledge on wavelet transform is introduced in Section 3. The method of on-line wavelength calibration through wavelet modulus maxima is also analyzed and explored in this section. Simulated analysis and experiments with real measured signals of this method, as well as a comparison of the proposed method with the general method based on quintic polynomial fitting, are discussed in Sections 4 and 5, respectively. Finally, the most important findings of this study as well as the restrictions are summarized in Section 6.
2. METHODOLOGY
A. DIAL Principle
DIAL is an attractive means for detecting , water vapor, temperature, humidity, aerosols, and other atmospheric constituents [25]. The diagram of the ground-based DIAL is shown in Fig. 2. Two branches of a pulsed laser, with similar wavelengths, are transmitted in the experiments on atmospheric composition detection through the ground-based DIAL system. One is in the center of the absorption peak and used to obtain maximum absorption, called the on-line wavelength (). The other laser is near the valley of absorption, called the off-line wavelength (). Two lasers are transmitted almost simultaneously and coaxially, and the wavelength of the laser rapidly changes between on-line and off-line. An interaction then occurs between the laser and the atmospheric compositions in the laser trace, and backscattering signals are received by the same receiving system used for both wavelengths of light. The molecular density of the gas can be derived from the intensity ratio of the laser echo signals for two wavelengths.
The lidar equations of two wavelengths in the DIAL system can be written as [26–28]where is the detection range, is the received power at range ( can be on-line or off-line wavelength), is the calibration constant for the lidar, is the light area of the receiving telescope, is the laser output power, is the backscatter coefficient of the atmosphere, is the extinction coefficient of the atmosphere (excluding ), is the trace gas number density, and is the absorption cross section of the trace gas. Because of the small range of wavelengths and the short time frame, several atmospheric parameters that slightly change with the wavelength can be regarded as constants in the DIAL system. Furthermore, closely neighboring spectral lines (on-line and off-line) are often adopted in practical atmospheric measurement. Consequently, the target reflectivity, system efficiency, and other factors, such as atmospheric attenuation, caused by the wavelength can be ignored [6,29].
Dividing Eq. (1) for on-line and off-line wavelengths, respectively, returns the range-resolved atmospheric concentration, expressed as where and are the beginning and the end of the integration interval, respectively. is the range resolution. and are on-line and off-line wavelengths, respectively.
Equation (2) indicates that a correct on-line wavelength is important in the detection of concentration. An error in the on-line wavelength calibration will affect the accuracy of the echo signal values, and this condition leads to a large error in the concentration measurement.
B. Emission System of DIAL
The simultaneous measurement system of the dual-wavelength laser is shown in Fig. 3. A tunable dye laser is used to generate lasers of different wavelengths. The laser of the target wavelength is generated via difference frequency mixing between the fundamentals of the Nd:YAG laser (1064 nm) and the dye laser (634 nm), which is pumped by the second harmonic of the Nd:YAG (532 nm). As a consequence, the wavelength of the output laser can be changed by tuning the dye laser whose wavelength is changed by a stepper motor [30].
Figure 3.Simultaneous emission system of the dual-wavelength laser.
In the DIAL system, the high-precision frequency calibration of the on-line wavelength has a significant influence on inversion precision. The wavelet modulus maxima described in Section 3 are used in this study to ensure the precise calibration of the on-line wavelength.
3. WAVELET MODULUS MAXIMA
With the characteristics of multiresolution analysis, wavelet transform can represent a signal by localizing it in both time and frequency domains [31]. Wavelet transform can perform multiscale refinement analysis of the functions and signals, where a larger window is used for low-frequency detection, whereas a smaller window is used for high-frequency detection. The singularity information of a signal on a specific point can be obtained accurately through the scaling and translation operations of the wavelet transform [23]. A singular point can be positioned by detection of the local modulus maxima in the wavelet transform maximum at fine scales. A wavelet has also been used for different lidar experiments in which atmospheric measurements are conducted [32]. There are some relevant concepts introduced to achieve an intensively understanding.
A. Lipchitz Index and Wavelet Modulus Maxima
Suppose , which belongs to the real number field on the square integrable function space [33,34]. Then, is considered a mother wavelet if the Fourier transform of this wavelet has the characteristic of , and can be regarded as the following wavelet function through scaling and translation operations to as [31,35]where is the scale factor and is the translation factor.
The process of singularity detection based on wavelet modulus maxima includes two main concepts. First is the Lipchitz index, which is used to measure the local regularity of function at point . Suppose , it can be regarded using the Lipchitz index in if and only if constant , , as follows
Generally, the Lipchitz index of a function implies its singularity size. A function with a high is smooth; by contrast, a small means great singularity for the function.
The second concept is modulus maxima. If Eq. (5) is satisfied while an arbitrary point belongs to the neighborhood of at the scale of , then (, ) is regarded as the modulus maxima point of the wavelet transform, and the modulus maxima line is the connecting line of all modulus maxima points in the scale space (, ) [36] as
The singularities of signal and noise have remarkable differences, which diversify the wavelet transform modulus maxima, thus making their wavelet transform modulus maxima completely different at different scales. The Lipchitz index of signal is greater than zero, and the modulus maxima increases with the decomposition scale. By contrast, the Lipchitz index of noise is less than zero, and the modulus maxima decreases with the decomposition scale.
B. Singularity Detection Through the Wavelet Modulus Maxima
The wavelet transform modulus maxima of various scales have different propagation characteristics between the signal and noise. Based on function singularity theory and the differences in the singularities between signal and noise, singularity detection can be performed through different propagation characteristics along the scale direction of the wavelet transform modulus maxima [37–39].
If is a low-pass smoothing function with second derivative whose integral is nonzero, the definitions of and are as where and satisfy the admissibility condition and can be used as a wavelet-generating function. Based on the assumption that , is the scaling of at the scale of . The wavelet transform of the mother wavelet corresponding to at the scale factor of can be expressed as
Notably, has a smoothing effect on . and are the first and second derivatives of the smooth function , respectively, at different scale factors. Consequently, the singular point in corresponds to a turning point on after the wavelet transform. This singular point is not only the maximum value in but also the zero point in . The first derivative not only locates the singular point but also determines the location of the point that changes the slowest, whereas the second-order derivative is unable to perform both. In this study, the essence of on-line wavelength calibration is the absorption peak location (i.e., the singularity detection of absorption lines). Therefore, the wavelet modulus maxima can achieve the calibration of on-line wavelength by both the first and second derivatives of the smooth function.
4. SIMULATION ANALYSIS
A. On-Line Wavelength Calibration Through the Wavelet Modulus Maxima
The simulated signals obtained from the HITRAN 2012 database are used to prove that the method we proposed is useful in the calibration of on-line wavelength. Most spectroscopic parameters of lines for the simulation analysis are obtained from HITRAN2012; the spectroscopic parameters of absorption lines of are from HITEMP 2010. Spectroscopic parameters of the absorption lines of , marked as C3-C5 (namely, R14-R18), and those of in this range are listed in Table 1. The absorption lines are also demonstrated in Fig. 4 with absorption cross sections of and molecules at 101325 Pa and 296 K calculated using the Voigt profile [40,41]. The curve with the right vertical axis is on a log scale as intensities of the lines are much smaller than those of .
Abbr.
Position
Intensity
bL(air)
E′′
n
δ0(air)
δ′(air)
P
T
C3
6358.654 375
1.7295E−23
0.076 53
81.9401
0.680
−4.92E−3
−6.3E−5
101325
296
C4
6359.967 286
1.7414E−23
0.074 85
106.1297
0.672
−4.98E−3
−8.3E−5
101325
296
C5
6361.250 392
1.7026E−23
0.073 55
133.4393
0.653
−5.60E−3
−6.8E−5
101325
296
H1
6357.881
3.430E−26
0.075
610.34
0.58
−0.0160
—
101325
296
H2
6358.894
1.090E−27
0.074
2764.70
0.53
−0.0175
—
101325
296
H3
6360.456
2.070E−28
0.041
2927.94
0.37
−0.0273
—
101325
296
H4
6361.442
8.875E−27
0.017
1327.12
−0.06
−0.0120
—
101325
296
H5
6361.838
1.020E−27
0.025
2972.83
0.09
−0.0171
—
101325
296
Table 1. Spectroscopic Parameters of and Involved in the Simulation Analysis
According to the HITRAN 2012 molecular spectroscopic database, three absorption peaks exist in this range of the 30012/00001 carbon dioxide band: R14, R16, and R18 [42]. Selection of the operating wavelength should consider many factors, such as low temperature sensitivity and small interference from other molecules. It can be noted from Fig. 4 that R16 is the most appropriate, as the intensity of this peak is the strongest, and the influence of water vapor in this band is less than that in R14 and R18. R16 has the highest signal-to-noise ratio (SNR) in this range because of the less noise and the largest differential optical depth. In conclusion, R16 is recommended for atmospheric measurements using DIAL at , and the simulated signals at the R16 region are selected as the signal source of on-line wavelength through the wavelet modulus maxima. Figure 5 shows the absorption line of at the region of R16.
Figure 5.Calculated absorption cross sections of the molecule at the region of R16.
The process of on-line wavelength calibration with the simulated signals consists of two stages. The wavelength of the output pulsed laser was first stepped around the peak area by the monitor of a wave meter whose accuracy is less than . After coarse calibration by the wave meter, a fine calibration based on the wavelet modulus maxima was used to accurately search for the on-line wavelength. Wavelet packet analysis is applied in wavelet modulus maxima analysis. The Gauss wavelet is used as the smooth function, and the decomposition scale is set to 5. Based on several largest wavelet modulus evolution curves that were obtained by the singularity detection through the wavelet modulus maxima, the one at the range of coarse calibration by the wave meter was selected as the on-line wavelength in this region. In addition, if more than one curve exists at the range of coarse calibration, the decomposition scale will increase until the absorption peak is located.
Figure 6 shows the calibration result of a simulated analysis with an SNR of 20, which is close to the real SNR, and 30 of the largest wavelet modulus evolution curves obtained by the singularity detection are presented. The on-line wavelength location is (1572.3362 nm), which is indicated as the red dotted line, while the real absorption peak of the simulated signal is (1572.3363 nm). Figure 6 indicates that the absorption peak can be accurately located through the wavelet modulus maxima on the basis of the coarse calibration by the wave meter.
Figure 6.Simulated result of on-line wavelength calibration through the wavelet modulus maxima in R16.
A total of 100 simulated experiments were conducted to evaluate the accuracy of on-line wavelength calibration. The statistical result of the on-line wavelength calibration through the wavelet modulus maxima is shown in Table 2.
Calibration Accuracy
0.1 pm
0.2 pm
0.5 pm
0.8 pm
>0.8pm
No.
31
18
44
6
1
Table 2. Statistical Result of the 100 Simulated Experiments Through the Wavelet Modulus Maxima
The statistical result shows that around 99% of the calibration results can be better than 0.8 pm, and 93% can be better than 0.5 pm when the SNR is 20. This result indicates that the calibration of on-line wavelength through wavelet modulus maxima is accurate and stable.
B. Comparison Between the Two Methods of On-Line Wavelength Calibration
The calibration of on-line wavelength by general method was compared with that by the wavelet modulus maxima with the same simulated signals and SNR to evaluate the effect of on-line wavelength calibration using wavelet modulus maxima.
The general method for on-line wavelength calibration of a pulsed laser is mainly via quintic polynomial fitting [6,43]. The wavelength that corresponds to the maximum value after fitting is selected as the on-line wavelength. Figure 7 shows the result of the on-line calibration through quintic polynomial fitting. The calibration result is (1572.3368 nm). Similarly, the statistical result of 100 simulated experiments through quintic polynomial fitting is shown in Table 3.
Figure 7.Simulated result of on-line wavelength calibration through quintic polynomial fitting in R16.
Both the accuracy and stability of on-line wavelength calibration with the quintic polynomial fitting are worse than those with the wavelet modulus maxima. Approximately 42% of the calibration results cannot attain 0.5 pm when the SNR is 20. To obtain an intuitive comparison result, the statistical results of the 100 simulated experiments on on-line wavelength calibration with the two methods are drawn into a scatter plot, which is shown in Fig. 8. The theoretical value of the on-line wavelength is indicated by the red solid line, and an error range of 0.8 pm is indicated by the black dotted line to evaluate the calibration accuracy. Figure 8 shows that a higher calibration accuracy and stability was achieved by the wavelet modulus maxima method.
Figure 8.Calibration result of the wavelet modulus maxima and polynomial fitting method with an SNR of 20.
A total of 100 simulated experiments on on-line wavelength calibration with different SNRs were performed through two methods to assess the applicability of the proposed method at different noise levels. The results are shown in Figs. 9–14, corresponding to SNRs of 80, 50, 30, 10, 5, and 1, respectively.
Figure 9.Calibration result of the wavelet modulus maxima and polynomial fitting method with an SNR of 80.
The statistical results of the simulated signals with different SNRs for on-line wavelength calibration conducted through the quintic polynomial fitting and the wavelet modulus maxima method are shown in Table 4. The results show the average of the absolute values and the standard deviation of 100 simulated experiments. For convenience, two abbreviations are used, namely, absolute values (ABS values) and standard deviation (SD values).
Method SNR
80
50
30
10
5
1
Wavelet Modulus Maxima
ABS(nm)
1572.3363
1572.3364
1572.3365
1572.3366
1572.3367
1572.3367
SD
2.2851E−12
1.5067E−4
3.1825E−4
4.6450E−4
5.1508E−4
6.1714E−4
Quintic Polynomial Fitting
ABS(nm)
1572.3368
1572.3368
1572.3368
1572.3369
1572.3372
1572.3373
SD
7.5201E−4
7.4352E−4
7.1890E−4
8.6116E−4
1.1728E−3
1.3906E−3
Table 4. Statistical Calibration Results of the Simulated Signals Through Two Methods with Different SNRs
The conclusion that can be drawn from the statistical calibration results of the simulated signals is as follows: accuracy and stability of on-line calibration through the quintic polynomial fitting method worsens with the decrease in SNR; this method cannot even be used when the SNR is less than 5. By contrast, although the wavelet modulus maxima method is subject to the effect of low SNR, it has strong noise immunity and consistently good accuracy and stability for on-line wavelength in the case of any SNR. When the SNR of signal is 1, about 91 out of 100 calibrated results through the wavelet modulus maxima method are better than 0.8 pm. However, only 48 out of 100 calibrated results through the quintic polynomial fitting method are better than 0.8 pm. In summary, the wavelet modulus-based method proposed in this study has a better effect in on-line calibration than general methods, both in terms of accuracy and stability, and it has distinct advantage especially in the calibration of signals with low SNRs.
Furthermore, as shown in Figs. 6 and 7, where SNR is 20, the difference between the wavelet method and the polynomial method is . The improvement of the wavelet method should be more significant in the retrieval of concentration by DIAL because the change of the absorption spectrum near the peak is extremely sharp. In addition, because the wavelet modulus maxima method has immunity from strong noise, the improvement of the retrieval of concentration should be larger when SNR is low.
5. EXPERIMENTS WITH REAL MEASURED SIGNALS
On the basis of the simulated signal analysis, the proposed method is tested by examination of real measurement data acquired by a 16 m gas absorption cell in our wavelength control unit. The result shows that the method is effective in calibrating the on-line wavelength of our DIAL system.
The system configuration of the wavelength control unit is shown in Fig. 15[44]. Eight percent of the pulsed laser lights transmitted from the laser system is used as the laser source of the wavelength control unit. The laser is then tapped to ∶ by a one-sided antireflection-coated glass, which is marked as M1. The lights of the 10% part are transmitted to a wave meter as the laser source of coarse calibration, and the rest 90% is split in half by a half-reflector, which is marked as M2. Two identical laser lights are then transmitted to the 16 m absorption cells—one is full of pure , the other is vacuum. Both lights transmitted through the 16 m absorption cell are detected by an infrared detector, and the laser intensity is collected by an oscilloscope, where the trigger signal comes from the laser system. The connecting lines marked as 1, 2, and 4 are bayonet nut connectors (BNCs) while those marked as 3, 5, and 6 are commercial cables. The absorption line of can be obtained by the ratio of the intensity of a two branches laser. In addition, the wavelength that corresponds to the maximum value is considered the absorption peak of , which can be measured by a pulsed wave meter, and that is the result of coarse calibration.
Figure 15.Wavelength control unit of the ground-based DIAL.
The absorption line of obtained by the wavelength control unit is used as the data source of the on-line wavelength calibration. Figure 16 shows the diagram of one group of real measured experiments on on-line wavelength calibration with the wavelet modulus maxima. The calibration result is (1572.3361 nm), which is indicated as a red dotted line. The calibration result for the quintic polynomial fitting method is (1572.3382 nm). Comparison of Fig. 6 with Fig. 16 shows that the calibration region for both methods is R16, but a large difference in the output wavelength exists. This difference is mainly caused by the laser performance. The difference in setting a wavelength and output wavelength laser leads to a difficult evaluation of the calibration accuracy because the theoretical wavelength absorption peak cannot be obtained, which is different in the simulated experiment. Given that the actual wavelength of the transmitted laser is always inconsistent with the setting wavelength, the result of on-line wavelength calibration cannot be validated on the basis of theoretical wavelength. In this study, the distance between two absorption peaks is measured to verify the wavelength calibration accuracy. Subtracting the distance measured between two adjacent peaks and the theoretical distance of these peaks, we can consider that the proposed method is accurate and effective for long-term stability if the result is within a certain error range.
Figure 16.Result of on-line wavelength calibration with real measured signals through the wavelet modulus maxima at the R16 region.
Sixteen groups of on-line wavelength calibration experiments are performed at the R16 and R18 regions with the use of a gas cell with a step size of 3 pm. The spanned wavelength range is set from 1571.93 to 1572.72 nm to obtain two absorption peaks in the scanning experiments. Sampling 260 wavelengths in the span range for each group takes 260 s. The result of the on-line wavelength calibration of the real measured experiments was analyzed; these experiments focused on the R16 and R18 regions and applied the wavelet modulus maxima method. The distance between the two absorption peaks in the 16 experiments is shown in Table 5. For convenience, three abbreviations are used, namely, theoretical values (T values), calibrated values (C values), and difference values (D values).
1
2
3
4
5
6
7
8
T values
0.32530
0.32228
0.32541
0.33157
0.32228
0.32535
0.33163
0.32535
C values
0.32228
0.32228
0.32767
0.33317
0.32228
0.32231
0.32911
0.32223
D values
0.00302
0
0.00226
0.00160
0
0.00304
0.00252
0.00302
9
10
11
12
13
14
15
16
T values
0.32228
0.31614
0.32228
0.31921
0.32228
0.33154
0.31922
0.32541
C values
0.31921
0.31921
0.32228
0.31614
0.31921
0.33461
0.31922
0.32541
D values
0.00307
0.00307
0
0.00307
0.00307
0.00307
0.00010
0
Table 5. Evolution of On-Line Wavelength Calibration Through the Wavelet Modulus Maxima (unit: nm)
The difference between the results obtained through the proposed method and the theoretical one is approximately 2.12 pm. Compared with the calibrated accuracy of the simulated signals, that of the real measured signals is worse, which is caused by the fluctuation of the pulsed laser. The wavelength of the same absorption peak will be different each time because the wavelength of the pulsed laser is always fluctuating, which is the main reason for a difficult pulse laser wavelength calibration; the evaluation error will also considerably increase as the two peaks are synchronously calibrated. The calibration effect will improve if a single absorption peak is calibrated.
In addition, the method proposed in this paper is used for the calibration of the on-line wavelength. As for the wavelength locking, we have proposed an independent criterion for wavelength drift, named the regular accuracy check, with detailed introduction in [44].
6. CONCLUSIONS
An alternative method based on wavelet modulus maxima is proposed in this study for the accurate on-line wavelength calibration of a pulsed laser, which is helpful to obtain accurate vertical profiles of atmospheric concentration. The principle of ground-based DIAL was applied, and the feasibility of detecting the singularity of signals on the basis of wavelet modulus maxima was examined.
The statistical results of 100 simulated experiments with an SNR of 20 show that the average of the absolute values and the standard deviation with the wavelet modulus maxima method are 1572.3365 and , respectively, and with the quintic polynomial fitting method, 1572.3368 nm and , respectively. Approximately 99% of the calibration accuracy of the statistical result can be better than 0.8 pm, and 93% can be better than 0.5 pm when the SNR is 20. A total of 100 simulated experiments on on-line wavelength calibration with different SNRs were conducted with the two methods to assess the applicability of the proposed method at different noise levels. Simulation analysis showed that on-line wavelength calibration based on wavelet modulus maxima can meet the requirements of stable precision and fast speed despite high noise levels in the simulated data. Last, 16 groups of real signal experiments were performed, and the mean accuracy of the frequency calibration was found to be 2.12 pm. This result confirmed the conclusions from the simulation analysis results that the wavelet modulus maxima method can be used for on-line wavelength calibration of a pulsed laser with more accuracy and stability than the other method. Moreover, the time spent for the program of the proposed method in this study is about 0.3 s; which is highly significant for the concentration detection of atmospheric . The wavelet modulus maxima method can also be used in off-line wavelength calibration to improve detection precision, and, more importantly, it can still effective at low SNRs.
One issue about the method proposed is that the parameter setting of fine calibration based on the wavelet modulus maxima varies with the change of signal sources to obtain an accurate result. Both the smooth function and the decomposition scale of the wavelet can be further studied to improve the precision and practicability in the on-line wavelength calibration in the future.
ACKNOWLEDGMENT
Acknowledgment. This research is supported by the National Natural Science Foundation of China (41127901), the Program for Innovative Research Team in University of Ministry of Education of China (IRT1278), the National Science Foundation of Hubei province (2015CFA002), the China Postdoctoral Science Foundation (2015M570667), and the Fundamental Research Funds for the Central Universities (2042015kf0015).
References
[1] Climate Change. The physical science basis. Working Group I Contribution to the Fifth Assessment Report of the Intergovernmental Panel on Climate Change(2013).
[3] R. Pachauri, Core Writing, A. Reisinger. Climate change 2007: synthesis report. Contribution of Working Groups I, II and III to the Fourth Assessment Report of the Intergovernmental Panel on Climate Change(2007).
[4] M. O. Andreae, C. D. Jones, P. M. Cox. Strong present-day aerosol cooling implies a hot future. Nature, 435, 1187-1190(2005).
[7] C. E. Miller, D. Crisp, P. L. DeCola, S. C. Olsen, J. T. Randerson, A. M. Michalak, A. Alkhaled, P. Rayner, D. J. Jacob, P. Suntharalingam, D. B. A. Jones, A. S. Denning, M. E. Nicholls, S. C. Doney, S. Pawson, H. Boesch, B. J. Connor, I. Y. Fung, D. O’Brien, R. J. Salawitch, S. P. Sander, B. Sen, P. Tans, G. C. Toon, P. O. Wennberg, S. C. Wofsy, Y. L. Yung, R. M. Law. Precision requirements for space-based XCO2 data. J. Geophys. Res., 112, D10314(2007).
[8] F. Chevallier, S. Maksyutov, P. Bousquet, F. M. Bréon, R. Saito, Y. Yoshida, T. Yokota. On the accuracy of the CO2 surface fluxes to be estimated from the GOSAT observations. Geophys. Res. Lett., 36, L19807(2009).
[12] L. Fiorani, W. Saleh, M. Burton, A. Puiu, M. Queißer. Spectroscopic considerations on DIAL measurement of carbon dioxide in volcanic emissions. J. Optoelectron. Adv. Mater., 15, 317-325(2013).
[13] U. N. Singh, J. Yu, M. Petros, T. Refaat, K. Reithmaier. Development of a pulsed 2-micron integrated path differential absorption lidar for CO2 measurement. Proc. SPIE, 8872, 887209(2013).
[16] S. Kameyama, M. Imaki, Y. Hirano, S. Ueno, S. Kawakami, M. Nakajima. Development of 1.6 micron CW modulation ground-based DIAL system for CO2 monitoring. Proc. SPIE, 7153, 71530L(2008).
[17] L. Fiorani, S. Santoro, S. Parracino, G. Maio, M. Del Franco, A. Aiuppa. Lidar detection of carbon dioxide in volcanic plumes. Proc. SPIE, 9535, 95350N(2015).
[25] A. Behrendt, V. Wulfmeyer, A. Riede, G. Wagner, S. Pal, H. Bauer, M. Radlach, F. Späth. Three-dimensional observations of atmospheric humidity with a scanning differential absorption lidar. Proc. SPIE, 7475, 74750L(2009).
[36] Z. Peng, Y. He, Z. Chen, F. Chu. Identification of the shaft orbit for rotating machines using wavelet modulus maxima. Mech. Syst. Signal Process., 16, 623-635(2002).