
Yiming Zhu, Chenjun Shi, Xu Wu, Yan Peng. Terahertz Spectroscopy Algorithms for Biomedical Detection[J]. Acta Optica Sinica, 2021, 41(1): 0130001
- Acta Optica Sinica
- Vol. 41, Issue 1, 0130001 (2021)
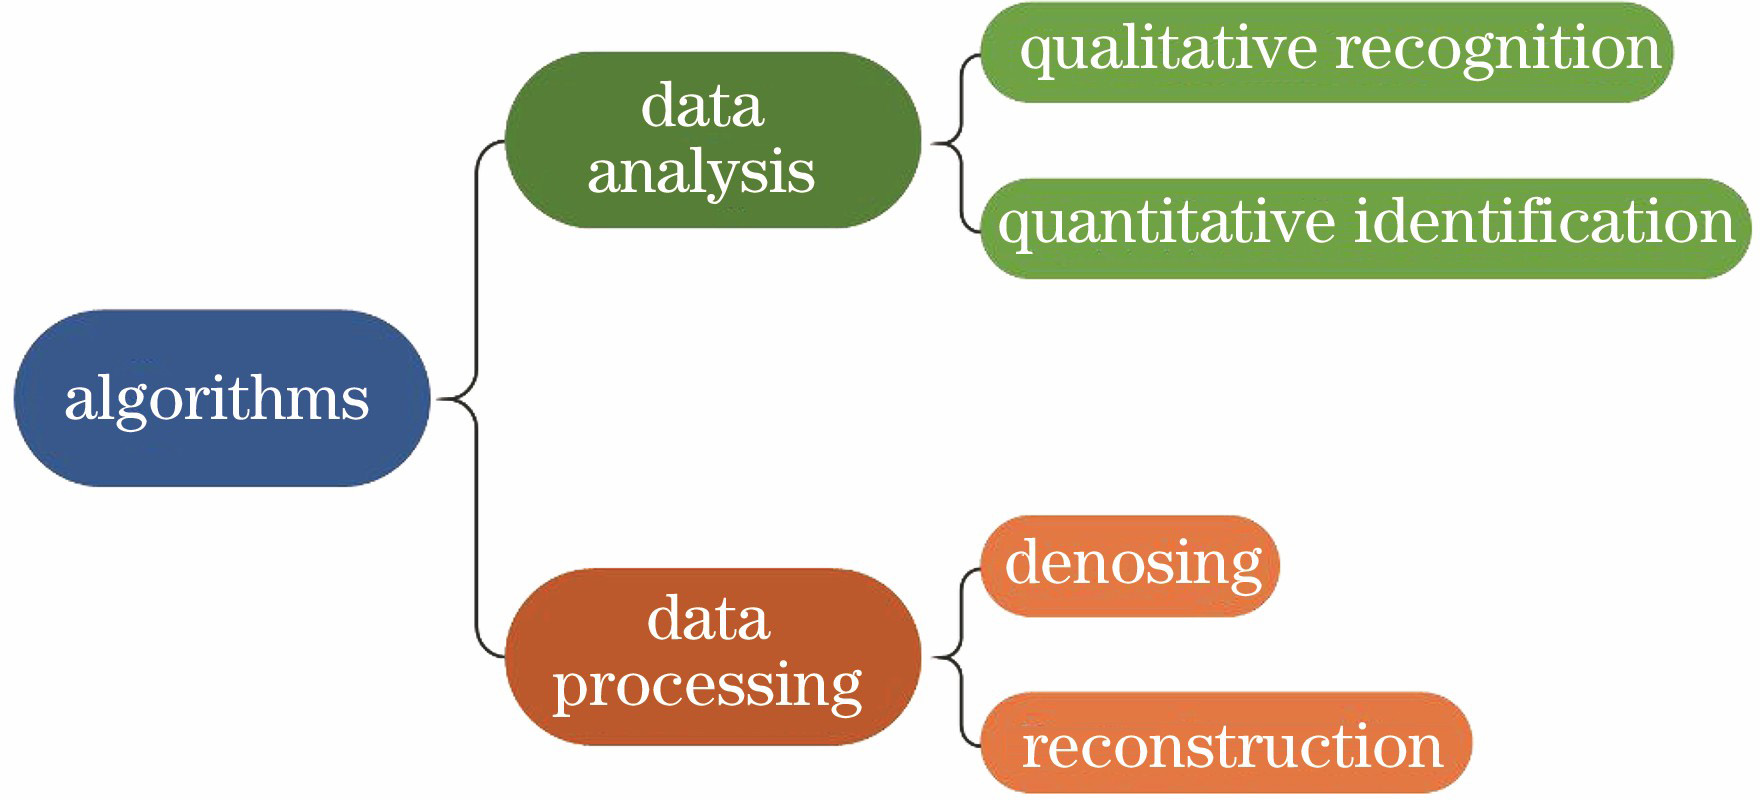
Fig. 1. Different algorithms applied in terahertz spectroscopy
![Calibration and validation results for water content prediction using KPLS models[26].(a) Established by the transmission spectra; (b) established by the absorption spectra](/richHtml/gxxb/2021/41/1/0130001/img_2.jpg)
Fig. 2. Calibration and validation results for water content prediction using KPLS models[26].(a) Established by the transmission spectra; (b) established by the absorption spectra
Fig. 3. LOOCV-SVR prediction for BSA with various concentrations in the range from 0.5 to 35 mg/mL. (a) Distributions of actual and predicted concentrations, the valid value of horizontal axis is from 1 to 135 and represents 135 spectral measurement values; (b) actual concentrations against predicted concentrations
Fig. 4. The spectra of mixture made by L-Glu, D-MI, GABA and CMH[40].(a) Experimental results of mixture; (b) comparison between experiment result and calculation result
Fig. 5. Score plot of the first two principle components for the EAE and normal monkey brain tissues[53]
Fig. 6. Terahertz absorption spectra of ten mixture samples[61]; (a) Original spectra; (b) spectra after wavelet transform; (c) spectra after baseline correction by polynomial fitting

Set citation alerts for the article
Please enter your email address
© Copyright 2018-2021 | Chinese Laser Press. All Rights Reserved 沪ICP备15018463号-20