• Chinese Optics Letters
  • Vol. 17, Issue 8, 082601 (2019)
Jinxing Xue1、2、3, Candong Liu1、2、*, Zhinan Zeng1、2、**, Ruxin Li1、2, and Zhizhan Xu1
Author Affiliations
  • 1Shanghai Institute of Optics and Fine Mechanics, Chinese Academy of Sciences, Shanghai 201800, China
  • 2Center of Materials Science and Optoelectronics Engineering, University of Chinese Academy of Sciences, Beijing 100049, China
  • 3University of Chinese Academy of Sciences, Beijing 100049, China
  • show less
    DOI: 10.3788/COL201917.082601 Cite this Article Set citation alerts
    Jinxing Xue, Candong Liu, Zhinan Zeng, Ruxin Li, Zhizhan Xu. Multiple-fringe structure of attosecond transient absorption spectrum driven by mid-infrared laser[J]. Chinese Optics Letters, 2019, 17(8): 082601 Copy Citation Text show less
    ATAS calculated for (a) 800 nm and (c) 2400 nm laser pulses with 3D-TDSE. For better observation, the region in (a) with the photon energy ranging from 16 to 20.5 eV is enlarged in (b). In (b) and (c), the absorption signals for 2s− and 2p2− are marked by white-dashed lines.
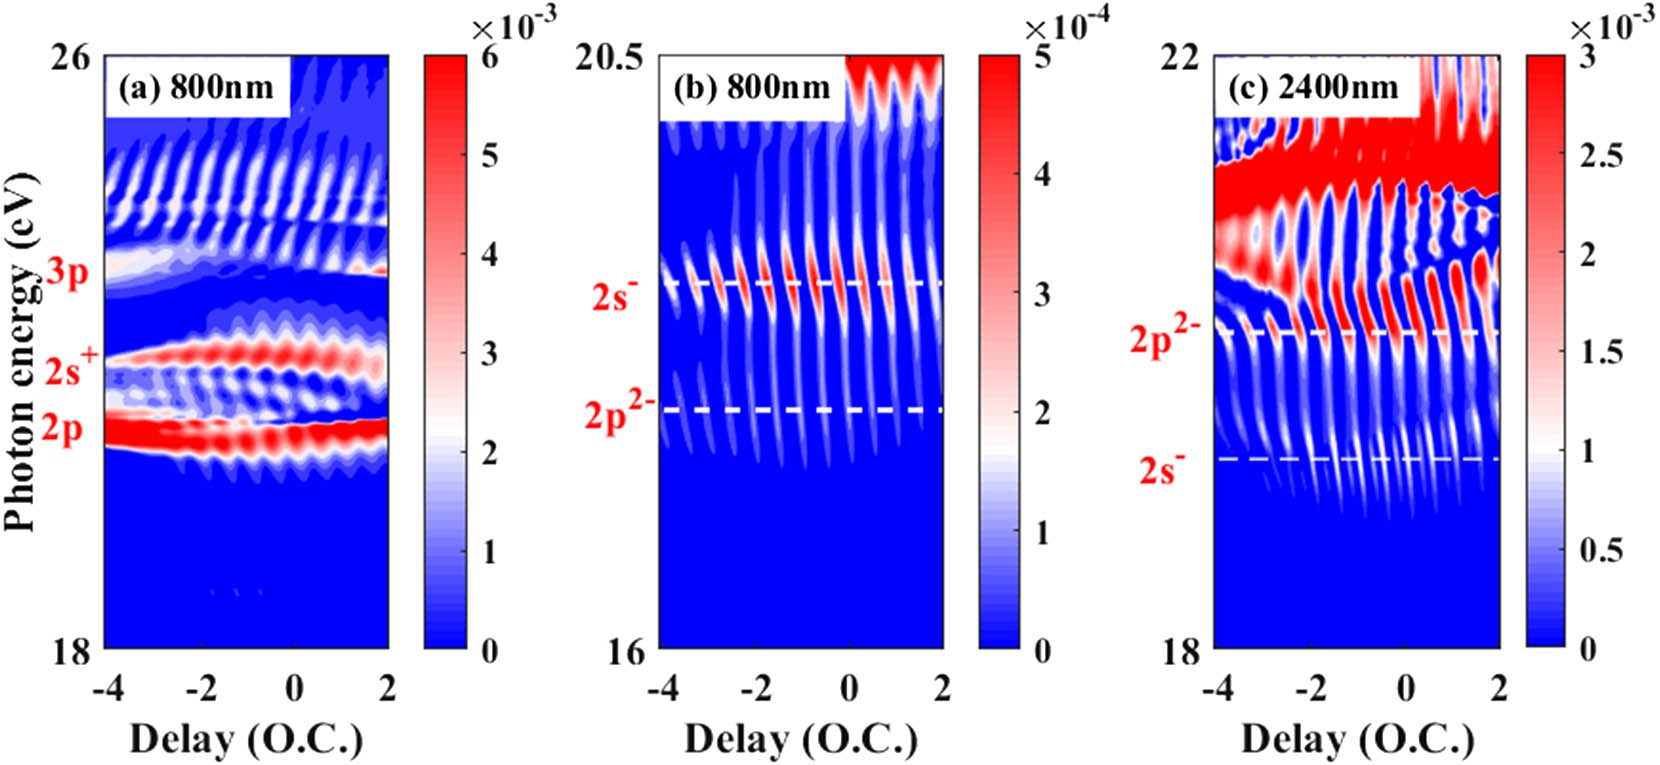
    Fig. 1. ATAS calculated for (a) 800 nm and (c) 2400 nm laser pulses with 3D-TDSE. For better observation, the region in (a) with the photon energy ranging from 16 to 20.5 eV is enlarged in (b). In (b) and (c), the absorption signals for 2s and 2p2 are marked by white-dashed lines.
    Relative oscillation strength of the 2ω, 4ω, and 6ω components calculated from the 3D-TDSE as a function of the dressing laser wavelength. (a) and (c) show the result for the 2s− state. (b) and (d) show the result for the 2p2− state. In (c) and (d), the blue solid lines indicate the strength of the 2ω component as reference, while the red-dot and the carmine-dashed lines represent the 4ω and 6ω components, respectively.
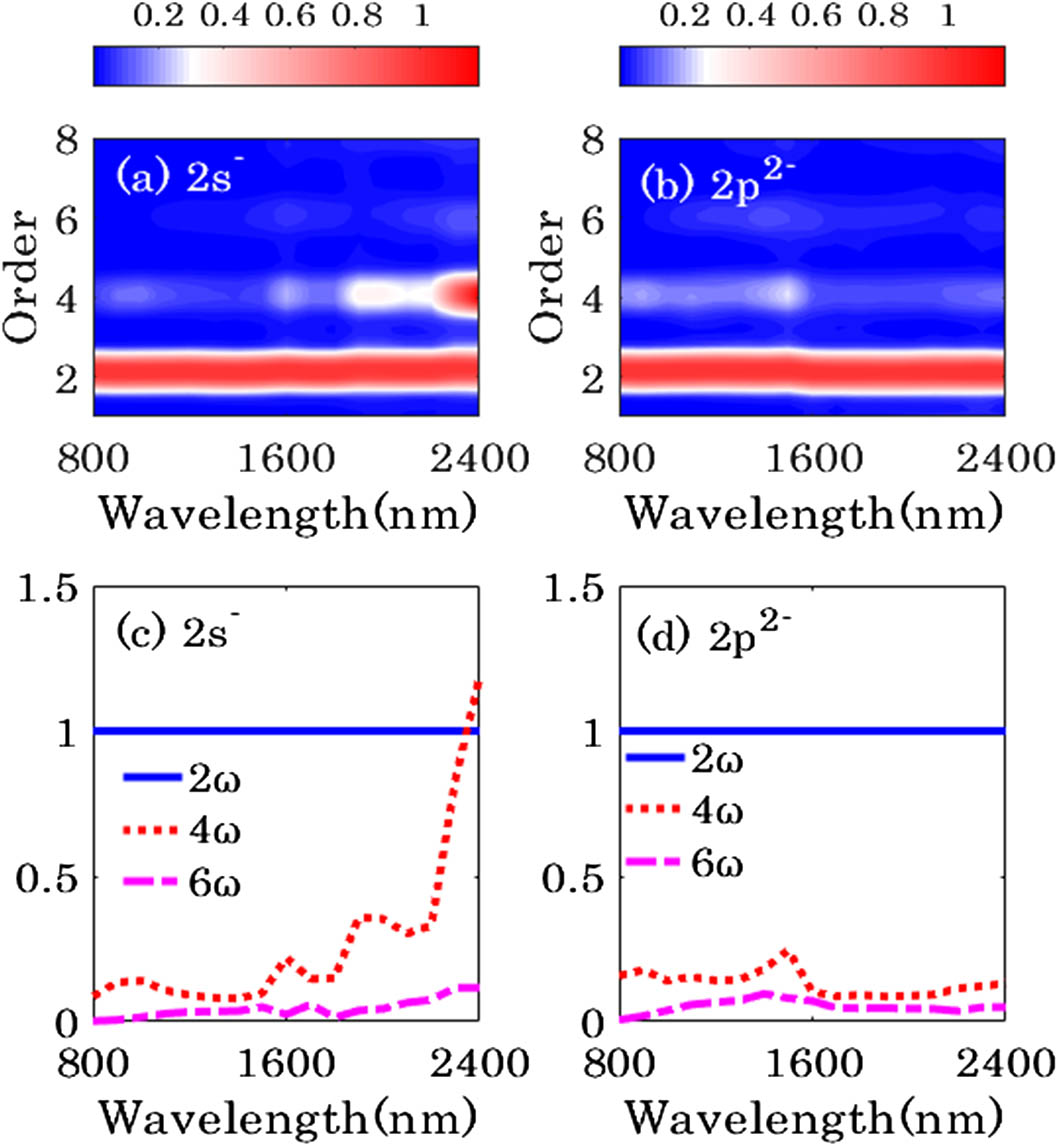
    Fig. 2. Relative oscillation strength of the 2ω, 4ω, and 6ω components calculated from the 3D-TDSE as a function of the dressing laser wavelength. (a) and (c) show the result for the 2s state. (b) and (d) show the result for the 2p2 state. In (c) and (d), the blue solid lines indicate the strength of the 2ω component as reference, while the red-dot and the carmine-dashed lines represent the 4ω and 6ω components, respectively.
    Modulation coefficients f1, f2, and f3 as a function of wavelength for two different Floquet states: (a) |2s,−1〉 and (b) |2p,−2〉. The dressing laser intensity is the same as that in Fig. 2. The black-square, red-cycle, and blue-triangle lines represent the modulation coefficients f1, f2, and f3, respectively.
    Fig. 3. Modulation coefficients f1, f2, and f3 as a function of wavelength for two different Floquet states: (a) |2s,1 and (b) |2p,2. The dressing laser intensity is the same as that in Fig. 2. The black-square, red-cycle, and blue-triangle lines represent the modulation coefficients f1, f2, and f3, respectively.
    Jinxing Xue, Candong Liu, Zhinan Zeng, Ruxin Li, Zhizhan Xu. Multiple-fringe structure of attosecond transient absorption spectrum driven by mid-infrared laser[J]. Chinese Optics Letters, 2019, 17(8): 082601
    Download Citation