We theoretically investigate the delay-dependent attosecond transient absorption spectra in the helium atom dressed by an infrared laser pulse in the wavelength range of 800–2400 nm. By numerically solving the three-dimensional time-dependent Schr dinger equation, we find that the absorption spectrogram exhibits a multiple-fringe structure for using the mid-infrared dressing pulse. The quantitative calculation of the transition matrix between different Floquet states provides direct evidence on the origin of the multiple-fringe structure. Our result shows that the wavelength of the dressing pulse is an important parameter and the unique feature of attosecond transient absorption spectroscopy can be induced in the mid-infrared regime.
The development of attosecond transient absorption spectroscopy (ATAS) in recent years[1–8] has benefited from the advent of attosecond extreme ultraviolet (XUV) pulse, which paves the way for progress in the investigation of ultrafast dynamics of electrons on their natural time scale[1,9–16]. The pump-probe scheme is usually implemented in ATAS, where whether the XUV and infrared (IR) pulse serves as a pump or probe depends on the specific situation. The pump pulse initiates the dynamics of electrons, and the time-delayed probe pulse is used to read out the information of the dynamical process by measuring the transmitted spectrum of the XUV pulse. The high temporal and spectral resolution enables ATAS to be an important tool for studying complex electronic processes. For example, ATAS has been used to study laser-induced electron dynamics of bound states and low-energy continuum states in atoms and molecules[2, 3, 5–7, 17–21], including the observation of the AC Stark effect[5] and sub-cycle absorption of virtual states in laser-dressed helium atoms[7]. The transformation of the asymmetric Fano spectral absorption lines into symmetric Lorentzian absorption peaks in doubly excited helium and vice versa, and from Lorentzian to Fano in singly excited helium[22], have been investigated. Moreover, the reshaping effect[23] and the chirp effect[24] of an XUV pulse on the transient absorption have been theoretically studied. ATAS has also been successfully applied to solid matter. The dynamic properties of valence and conduction bands in silicon have been experimentally studied[25–27].
In general, most of the works on ATAS are based on 800 nm near infrared (NIR) wavelength lasers, where ATAS mainly has one absorption signal in one half cycle of NIR laser. If the driving laser wavelength is increased to the mid-infrared (MIR, ) range, the electron will experience more time within one optical cycle, which can accumulate a larger phase. Consequently, some new features and dynamic process may emerge. To explore this new parameter regime, we numerically calculate the ATAS of a singly excited helium atom under MIR and attosecond XUV pulses. By varying the time delay between the two pulses, we find a feature of grouped multiple fringes in the ATAS. As the wavelength of the dressing laser pulse varies from 800 nm to 2400 nm, the number of absorption peaks in each group increases.
The three-dimensional time-dependent Schrödinger equation (3D–TDSE) under single active electron approximation is used to simulate the absorption spectrum of helium atom. A detailed description of this 3D-TDSE can be found in reference[24].
Sign up for Chinese Optics Letters TOC. Get the latest issue of Chinese Optics Letters delivered right to you!Sign up now
The dipole can be calculated as . Here, is the time-dependent wave function of electron and x is a position operator. This time-dependent dipole is driven by the total electric field comprising the MIR and XUV pulses, representing the response of an electron to an external electric field. The Fourier transform of this dipole oscillation yields the dipole spectrum , from which the ATAS can be written as[23,28], . Here, is the time delay between the MIR and XUV pulses, and is the spectrum of the XUV pulse. The positive (negative) value of is the absorption (emission) of light at frequency .
The intensity of the isolated XUV pulse used in our simulation is , which can be easily obtained from high harmonic generation. The central photon energy of the XUV pulse is 21 eV, and its transform-limited duration is 300 as, resulting in a bandwidth of 6 eV. The bandwidth of this XUV pulse can cover all the excited states below the ionization threshold (). To avoid the nonlinear effect of the MIR field, a relatively weak MIR pulse is used.
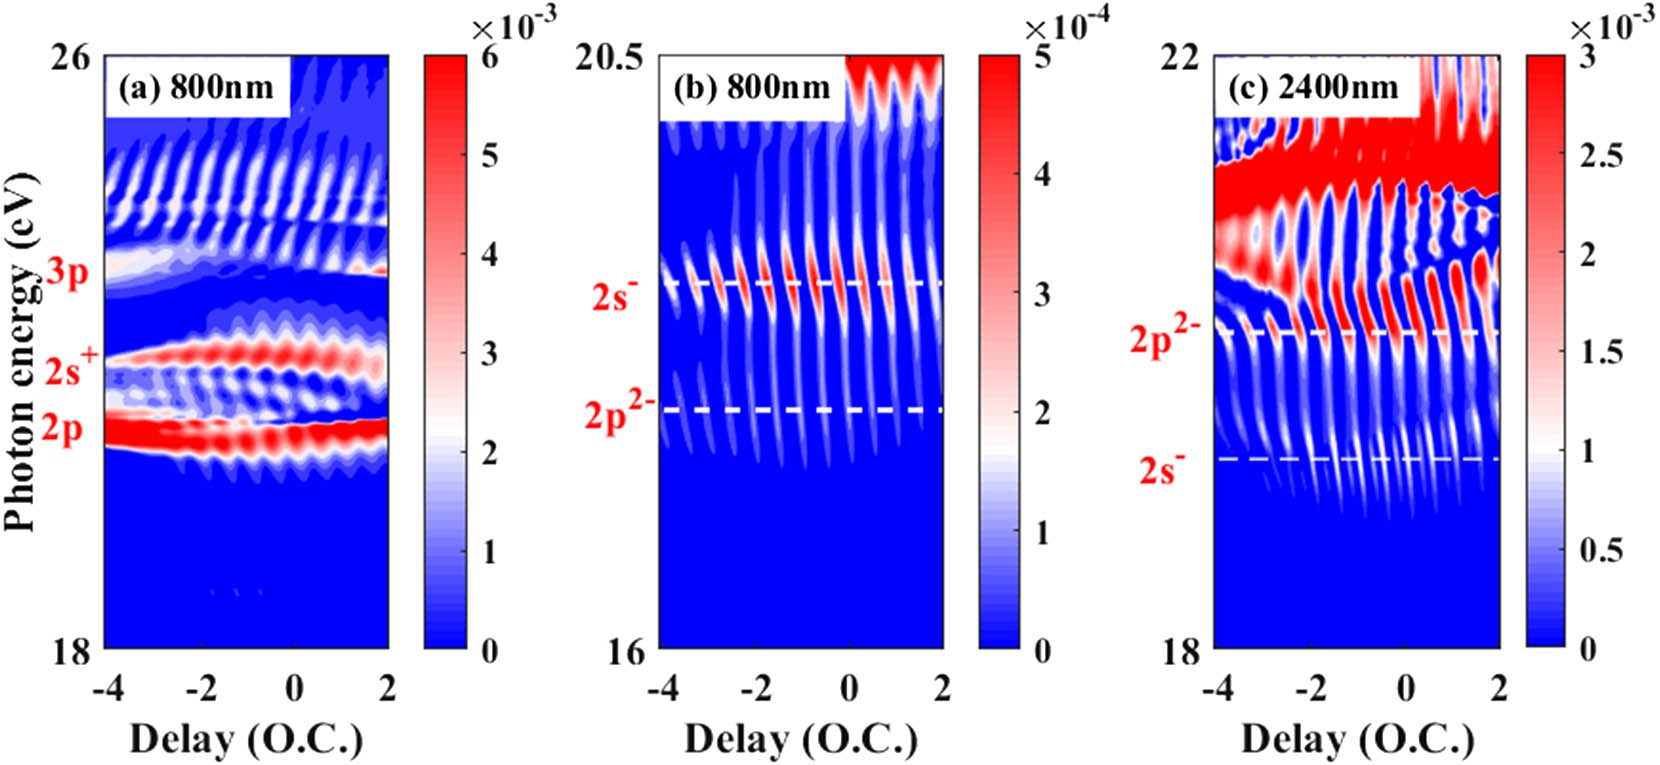
The ATAS calculated for laser wavelengths of 800 nm and 2400 nm is shown in Figs. 1(a) and 1(c), respectively. The duration of the IR (MIR) laser pulse used in the simulation is four optical cycles (O.C.). The laser intensity is fixed at . The positive (negative) delay means that the XUV pulse arrives after (before) the MIR pulse. Features like the AC Stark effect and the laser-induced states (LIS) in the previous work can be clearly observed in Figs. 1(a) and 1(c). In this work, the LIS and are chosen for analysis because these two states are far away from higher excited states so that the effects of the higher excited states can be ignored. The notation means that the LIS energy is one-laser-photon energy below the atomic eigenstate 2s. In Fig. 1(c), the energies of the LIS and are indicated by the white-dashed lines. The energies of the 2p, 3p, and states are also labeled on the left side in Fig. 1(a). For the case of 800 nm, the absorptions located at and are about one order of magnitude smaller than that located at 2p. For better visualization, the ATAS around and is enlarged, as shown in Fig. 1(b) with a different color scale. In Fig. 1(b), the ATAS around is half-cycle modulated (only one fringe in one half-cycle) along the delay axis, while for 2400 nm in Fig. 1(c) the ATAS around exhibits a multiple-fringe structure, forming the group feature spaced by a half optical cycle. Here, a group feature means that more than one absorption peak is grouped together within one half-cycle delay, as shown by the lower white-dashed lines in Fig. 1(c). For the ATAS located at , there is no group feature for both wavelengths, viz., 800 nm and 2400 nm, as shown in Figs. 1(b) and 1(c), respectively.
Figure 1.ATAS calculated for (a) 800 nm and (c) 2400 nm laser pulses with 3D-TDSE. For better observation, the region in (a) with the photon energy ranging from 16 to 20.5 eV is enlarged in (b). In (b) and (c), the absorption signals for and are marked by white-dashed lines.
As reported in previous work[4,28], the and oscillation frequencies of the absorption signals can be observed at some specific positions. In our work, we quantitatively investigate the oscillation strength of the , , and components of LIS and dependent on the dressing laser wavelength by performing a Fourier transformation along the delay axis. To make it clear, we take the component as reference, and the relative strengths of and components can be obtained as a function of laser wavelength, as shown in Figs. 2(a) and 2(b). In Fig. 2(a), we can clearly see the increase of the component with the increase of the laser wavelength. To draw a quantitative comparison, the relative strengths for the (blue-solid), (red-dot), and (carmine-dashed) components are plotted in Figs. 2(c) and 2(d).
Figure 2.Relative oscillation strength of the , , and components calculated from the 3D-TDSE as a function of the dressing laser wavelength. (a) and (c) show the result for the state. (b) and (d) show the result for the state. In (c) and (d), the blue solid lines indicate the strength of the component as reference, while the red-dot and the carmine-dashed lines represent the and components, respectively.
In Fig. 2(c), one can see that the component is stronger than the component when the wavelength reaches 2400 nm. Around this wavelength, the group feature can be clearly observed, as shown in Fig. 1(c). The component can be ignored due to its small value, but it is still increasing. For the shown in Fig. 2(d), the and components are much smaller than the component, which makes the multiple fringe structure unclear in Fig. 1(c).
As mentioned above, the 3D-TDSE model has shown the high-frequency oscillation of the ATAS dependent on the laser wavelength; we still need the Floquet theory to uncover the role of the MIR and XUV pulses in the ATAS. First, in the Floquet picture, the interaction between the MIR field and the atom is considered as a unified eigensystem, forming a series of dressed states (Floquet states) in which the energies for a group of Floquet states originating from the same field-free atomic state are separated by one MIR photon. Second, the XUV pulse interacts with the new generated system by pushing the ground-state electron into different Floquet states within the spectrum of the XUV pulse. The concept of Floquet states is very useful for analyzing the LISs occurring in the transient absorption. The ideas and notations in this section follow the work of Wu et al.[28].
In the Floquet theory, the Floquet Hamiltonian is expanded in the direct product of atomic states and the ‘Fourier basis’ as
Here, is the Floquet Hamiltonian, , and these “Fourier bases” can also be understood as the photon number basis. The symbol denotes the direct product. denotes the transition elements between the atomic states and . After diagonalizing the Floquet matrix [Eq. (1)], the time-independent Floquet state and its energy can be obtained. Once the electronic wave function is constructed from these time-independent Floquet states, the dipole oscillation induced by the quantum beat between different Floquet states and the ground state can be written as[28]
Here, is the Floquet energy, is the ground state, and is the pump-probe delay. is the dipole operator of the XUV pulse, meaning that the dipole described by Eq. (2) is only induced by the XUV pulse. This time-dependent dipole oscillation can be used to analyze the features of the absorption spectrum.
The Floquet theory has already been used to analyze the absorption process in ATAS[28,29]. This is because the Floquet state is equivalent to LIS and can be analytically or numerically obtained. In what follows, we only focus on the absorption signals for the and states.
We use three atomic states, viz., 1s, 2s, and 2p, as the basis, and 13 Floquet ladders for each atomic state, which is large enough to describe the absorption process accurately. According to Eq. (2), the time- and delay-dependent dipole, which describes the absorption at energy position , can be written as
The Fourier transformation of this time-dependent dipole gives the dipole spectrum. Substituting this dipole spectrum into the response function, ignoring the spectrum profile of the electric field, and setting the spectrum phase of the electric field to be , the response function can be written as
Here, is a delta function corresponding to the absorption located at (or LIS ). is the modulation function, and represents modulation. In Eq. (4), the transition element determines the strength of absorption at the energy position . The modulation function g() can be written more explicitly in the form
It should be noted that the component in Eq. (5) gives a basis for the absorption signals. In addition, it is clear that the strength of the oscillation is determined by the sum of two transition matrix elements and , physically meaning that two quantum paths interfere. The two involved quantum states are and . For instance, the oscillation strength of the component for is determined by the interference of quantum paths from and . This result disagrees with previous work where the oscillation of is attributed to the interference from quantum paths and [28]. For convenience, Eq. (5) can be rewritten as . Here, and . When taking as reference, the modulation function can be reduced to
Here, . Except for , the other coefficients , , and can be called modulation coefficients as they represent the relative modulation strength of the , , and modulation components. Usually, the coefficient is maximum, resulting in the strongest modulation. For instance, for a laser pulse with a wavelength of and intensity , the modulation coefficients , , and for the Floquet state are , , and . Obviously, , and the modulation will be dominant in ATAS. This is indeed the case, as it can be seen from Fig. 1(b) that only the half-cycle modulation at is visible. It is therefore found that, from Eq. (6), the modulation function describes the group features in ATAS. To confirm this conclusion further, the modulation coefficients , , and are calculated upon scanning the wavelengths from 800 nm to 2400 nm. The laser intensity is kept the same as that in Fig. 2.
In Figs. 3(a) and 3(b), the modulation coefficients (black-square), (red-cycle), and (blue-triangle) are calculated for the absorption lines at Floquet states and , respectively. Comparing the results shown in Fig. 3(a) with those in Fig. 2(c), we identify that the modulation coefficients calculated through the Floquet theory have successfully revealed the relative strength of the , , and modulation frequency for . The same conclusion can be drawn for from the results shown in Figs. 3(b) and 2(d). In Fig. 3(a), when the laser wavelength is shorter than 2000 nm, the coefficient is much smaller than , meaning that the modulation is dominating and the group feature cannot be observed in ATAS. With increasing wavelength, becomes comparable to , which means that the modulation is no longer dominant, causing the appearance of the group feature in ATAS. When the wavelength is tuned to 2400 nm, is even greater than . Therefore, the modulation is dominant, resulting in two absorption peaks in one group, as shown in Fig. 1(c). The coefficient increases slowly with increasing wavelength, but it is still too small to affect the absorption process. In Fig. 3(b) the coefficients and are both smaller than ; hence, the group feature is invisible. It should be noted that the MIR laser pulse is a monochromatic plane wave and the XUV pulse is assumed to be a delta function temporally in the ATAS Floquet theory. The agreement between Fig. 3 and Fig. 2 confirms that the Floquet theory can shed light on the multiple fringe structure of the ATAS very well.
Figure 3.Modulation coefficients , , and as a function of wavelength for two different Floquet states: (a) and (b) . The dressing laser intensity is the same as that in Fig. 2. The black-square, red-cycle, and blue-triangle lines represent the modulation coefficients , , and , respectively.
In conclusion, our work presents a theoretical simulation of the ATAS of the helium atom, with emphasis on the wavelength of the dressing laser pulse in the MIR range. Two methods, viz., the 3D-TDSE and the Floquet theory, are used to reveal the novel characteristics of the ATAS of the helium atom. We find that the absorption spectrum shows a structure of grouped multiple fringes that are dependent on the laser wavelength. Using the Floquet theory, we confirm that the grouped structures are the result of the superposition of different oscillation components, and the number of absorption peaks in each group is determined by the relative value of the transition matrix from the ground state to relevant Floquet states. For the 2400 nm laser, two absorption peaks are grouped together. In addition to the AC Stark effect and the non-adiabatic effect, this group feature is a prominent feature in ATAS when the laser wavelength is tuned to the MIR.