• Laser & Optoelectronics Progress
  • Vol. 58, Issue 3, 3000051 (2021)
Zhao Xudong1, Xu Yinsheng1、2, Zhang Xianghua1, and Zhao Xiujian1
Author Affiliations
  • 1State Key Laboratory of Silicate Building Materials, Wuhan University of Technology, Wuhan , Hubei 430070, China
  • 2State Key Laboratory of Luminescent Materials and Devices, South China University of Technology, Guangzhou , Guangdong 510640, China
  • show less
    DOI: 10.3788/LOP202158.0300005 Cite this Article Set citation alerts
    Zhao Xudong, Xu Yinsheng, Zhang Xianghua, Zhao Xiujian. Research Advancements in Optical Fiber Evanescent Wave Biochemical Sensing[J]. Laser & Optoelectronics Progress, 2021, 58(3): 3000051 Copy Citation Text show less
    Fiber structure type: tapered fiber, U-shaped fiber, microstructure fiber, D-shaped fiber
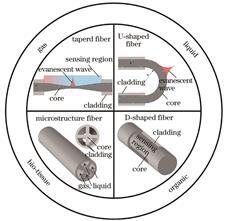
    Fig. 1. Fiber structure type: tapered fiber, U-shaped fiber, microstructure fiber, D-shaped fiber
    Optical fiber evanescent wave sensing
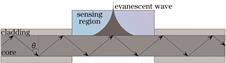
    Fig. 2. Optical fiber evanescent wave sensing
    Red shift of interference spectrum for a functionalized tapered optical fiber sensor used to detect Dengue E protein. (a) Without PMMA surface functionalization[15]; (b) with PMMA surface functionalization[16]
    Fig. 3. Red shift of interference spectrum for a functionalized tapered optical fiber sensor used to detect Dengue E protein. (a) Without PMMA surface functionalization[15]; (b) with PMMA surface functionalization[16]
    Nucleic acid functionalized fiber optic probes[22]. (a) Schematic illustration of the sandwich-type assembly based Ade detection strategy; (b)calibration curve of Ade
    Fig. 4. Nucleic acid functionalized fiber optic probes[22]. (a) Schematic illustration of the sandwich-type assembly based Ade detection strategy; (b)calibration curve of Ade
    Schematic diagram of experimental setup used to characterize fabricated sensor[30]
    Fig. 5. Schematic diagram of experimental setup used to characterize fabricated sensor[30]
    Fe2O3 nanotube coating micro-fiber interferometer[32]. (a) Diagrammatic sketch of gas sensing principle for the Fe2O3 coated MFI; (b) sectional view for the multi-core fiber
    Fig. 6. Fe2O3 nanotube coating micro-fiber interferometer[32]. (a) Diagrammatic sketch of gas sensing principle for the Fe2O3 coated MFI; (b) sectional view for the multi-core fiber
    MIR molecular fingerprint region[38]
    Fig. 7. MIR molecular fingerprint region[38]
    Evanescent wave biochemical sensing of chalcogenide fibers. (a) FEWS spectra of fed (solid line) and starved (dashed line) mice liver[41]; (b) human lung cell infrared spectra recorded with the TAS glass fiber[37]
    Fig. 8. Evanescent wave biochemical sensing of chalcogenide fibers. (a) FEWS spectra of fed (solid line) and starved (dashed line) mice liver[41]; (b) human lung cell infrared spectra recorded with the TAS glass fiber[37]
    DIAFIR company’s product in France: TAS fiber evanescent wave sensor[42]
    Fig. 9. DIAFIR company’s product in France: TAS fiber evanescent wave sensor[42]
    Polymer-coated fiber sensor[44]. (a)General measurement principle of EWS of the polymer-coated fiber sensor;(b)IR absorption spectra of six concentrations of the p-xylene aqueous solution recorded by coated and uncoated ChG-TF
    Fig. 10. Polymer-coated fiber sensor[44]. (a)General measurement principle of EWS of the polymer-coated fiber sensor;(b)IR absorption spectra of six concentrations of the p-xylene aqueous solution recorded by coated and uncoated ChG-TF
    SEM picture[14]. (a) Holes with different pulse energy; (b) hole with 24 mW pulse energy; (c) hole-array channels; (d) linear channels; (e) measured spectral responses at different CH4 concentrations; (f) absorption peak intensity as a function of CH4 concentration
    Fig. 11. SEM picture[14]. (a) Holes with different pulse energy; (b) hole with 24 mW pulse energy; (c) hole-array channels; (d) linear channels; (e) measured spectral responses at different CH4 concentrations; (f) absorption peak intensity as a function of CH4 concentration
    AnalyteCoatingDetection limitLinear concentration rangeSensitivityResponse time /sReference
    Dengue virus3-aminopropyltriethoxysilane Dengue virus antibody0.1 μg·L-10.1‒1 μg·L-1

    7×10⁻⁶

    pg·mL-1

    ≤2 minRef. [17]
    Red blood cellP-doped graphene0‒104 mg·L-1>106pm·mg-1·L-1<50 sRef. [20]
    Procalcitonin

    Gold nanoparticles

    Procalcitonin antibody

    95 fg·mL-10.0001‒100 ng·mL-1≤15 minRef. [21]
    AdenosineDNA25 mmol·L-150‒3.5 mmol·L-1<300 sRef. [22]
    Methylene blue2‒50 μmol·L-1≤16 minRef. [25]
    Fe3+Carbon dot0.77 μg·L-10‒300 μg·L-10.0061 nm·μg-1·L-1≤4 minRef. [28]
    Cd2+Propylene thiourea44.8 μg·L-10‒13440 μg·L-1Ref. [29]
    pH

    ZnO micro-flower

    hydrogel

    Acid: 2.59 nm·pH-1

    Alkali: 0.70 nm·pH-1

    pH:3‒11≤10 sRef. [30]
    Ammonia

    PDMDAAC

    Sodium pyrophosphate

    0.5 mg·L-10.5‒50 mg·L-1<3 minRef. [33]
    CH2OZnO nanorod1.6 μg·L-10‒0.18 mg·L-19.78 dBm·mg-1·L-1200 sRef. [34]
    Table 1. Research summary of silica fiber biochemical sensing
    Fiber typeTransmission range /μmAttenuation /(dB·m-1)AnalyteCharacteristic peak /μmConcentration rangeResponse time /sReference
    Ge20Ga5Sb10S65(MoS2Malignant tumor tissue10-9‒10-10 RIURef. [39]

    As40S60

    (Graphene)

    Hemoglobin118 μg·dL-1Ref. [40]

    Ge-As-Se-Te

    (Polydopamine)

    2.5‒160.57@6.52 μmP-xylene6.650 μg·mL-1<600Ref. [44]
    Ge26As17Se25Te322‒100.3‒1@5.2‒9.3 μmCH3CH2OH

    7.87‒8.33

    8.92‒10

    0‒20%(mole fraction)

    0‒50% (mole fraction)

    Ref. [45]
    Ge26As17Se25Te325‒9CH3COCH3

    7.33

    8.18

    1%(mole fraction)Ref. [47]
    Ge20Se60Te202.5‒153.4@5.9 μm

    CH3OH

    CH2Cl2

    9.78

    7.9

    Ref. [49]
    GaGeSbS3‒5CHCl34.16Ref. [50]
    Ge26As17Se25Te325.5‒8.5<1Antigenic additive7.830‒1%(volume raction)Ref. [52]
    As2S33‒101CH43.32>10-4<20Ref. [14]
    Ge-Te-AgI8‒13.5<10CO2

    4.25

    15

    Ref. [38]
    Table 2. Research summary of MIR biochemical optical fiber sensor
    Zhao Xudong, Xu Yinsheng, Zhang Xianghua, Zhao Xiujian. Research Advancements in Optical Fiber Evanescent Wave Biochemical Sensing[J]. Laser & Optoelectronics Progress, 2021, 58(3): 3000051
    Download Citation