
Haojian Xing, Jie Zhang, Zenghe Yin, Yong Zhu. Carbon Nanotube/Silver Used for Highly Sensitive Self-Calibrating Raman Detection[J]. Acta Optica Sinica, 2020, 40(12): 1224001
- Acta Optica Sinica
- Vol. 40, Issue 12, 1224001 (2020)
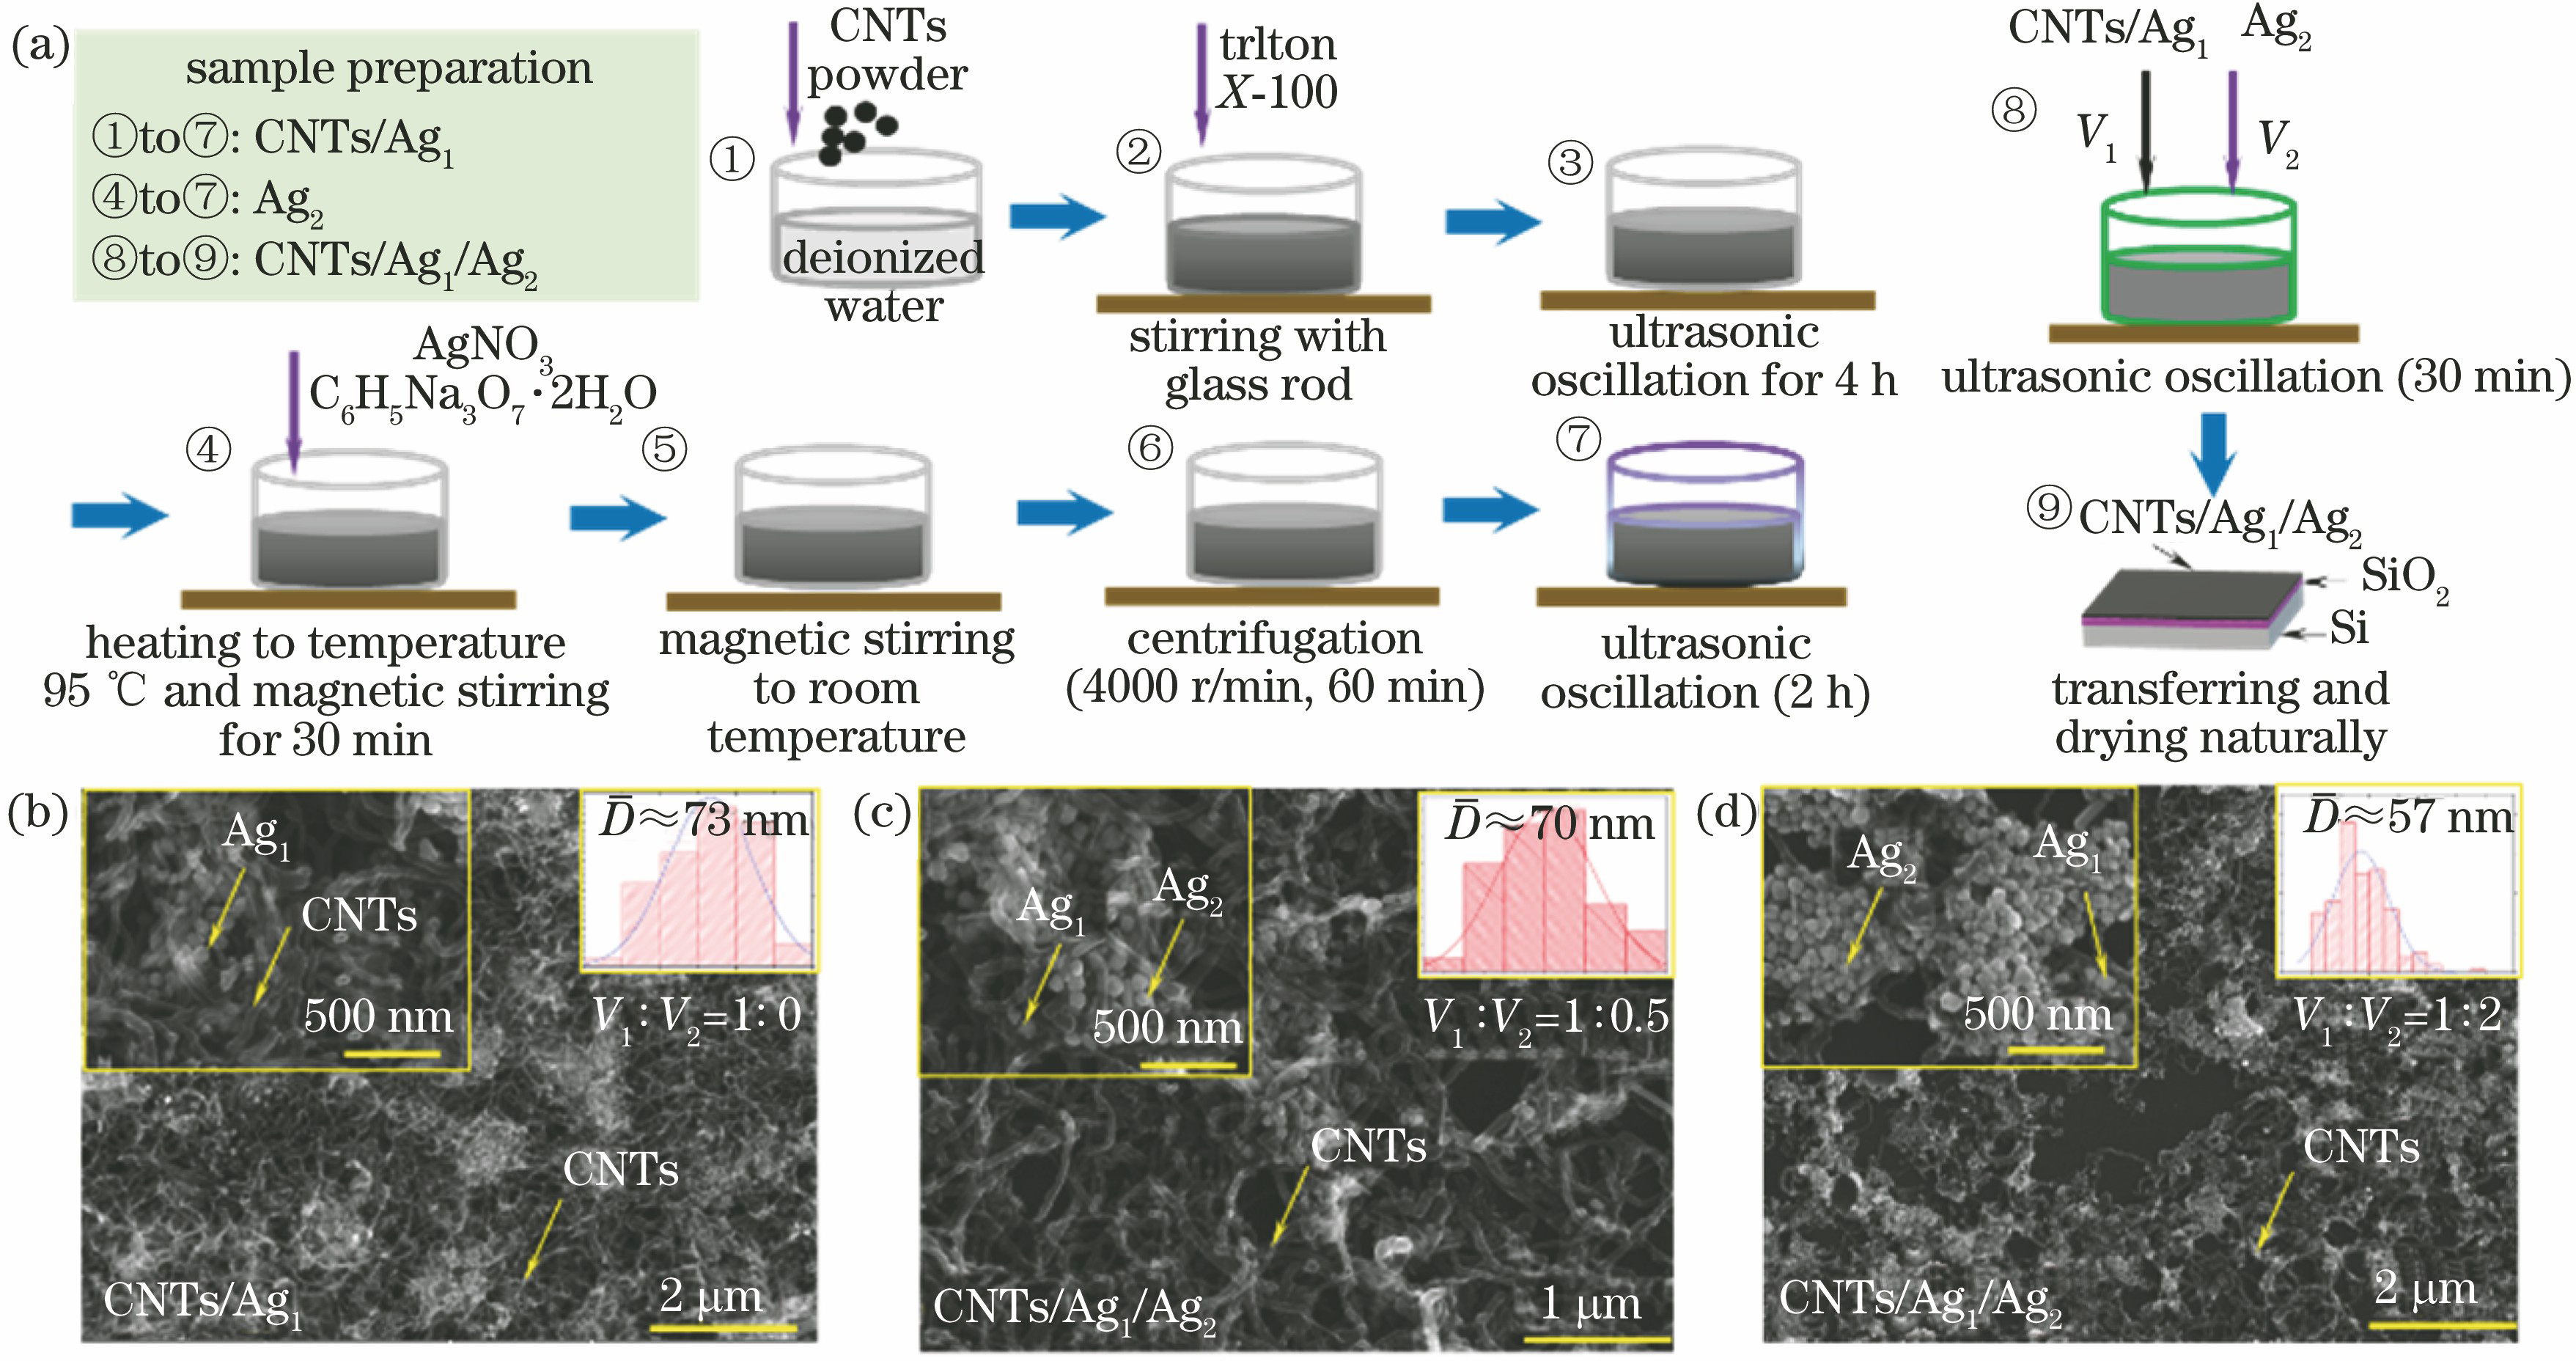
Fig. 1. Preparation process and SEM characterization of CNTs/Ag1/Ag2. (a) Sample preparation process; SEM images of CNTs/Ag1/Ag2 substrates under different volume ratios of CNTs/Ag1 and Ag2: (b) 1∶0, (c) 1∶0.5, and (d) 1∶2
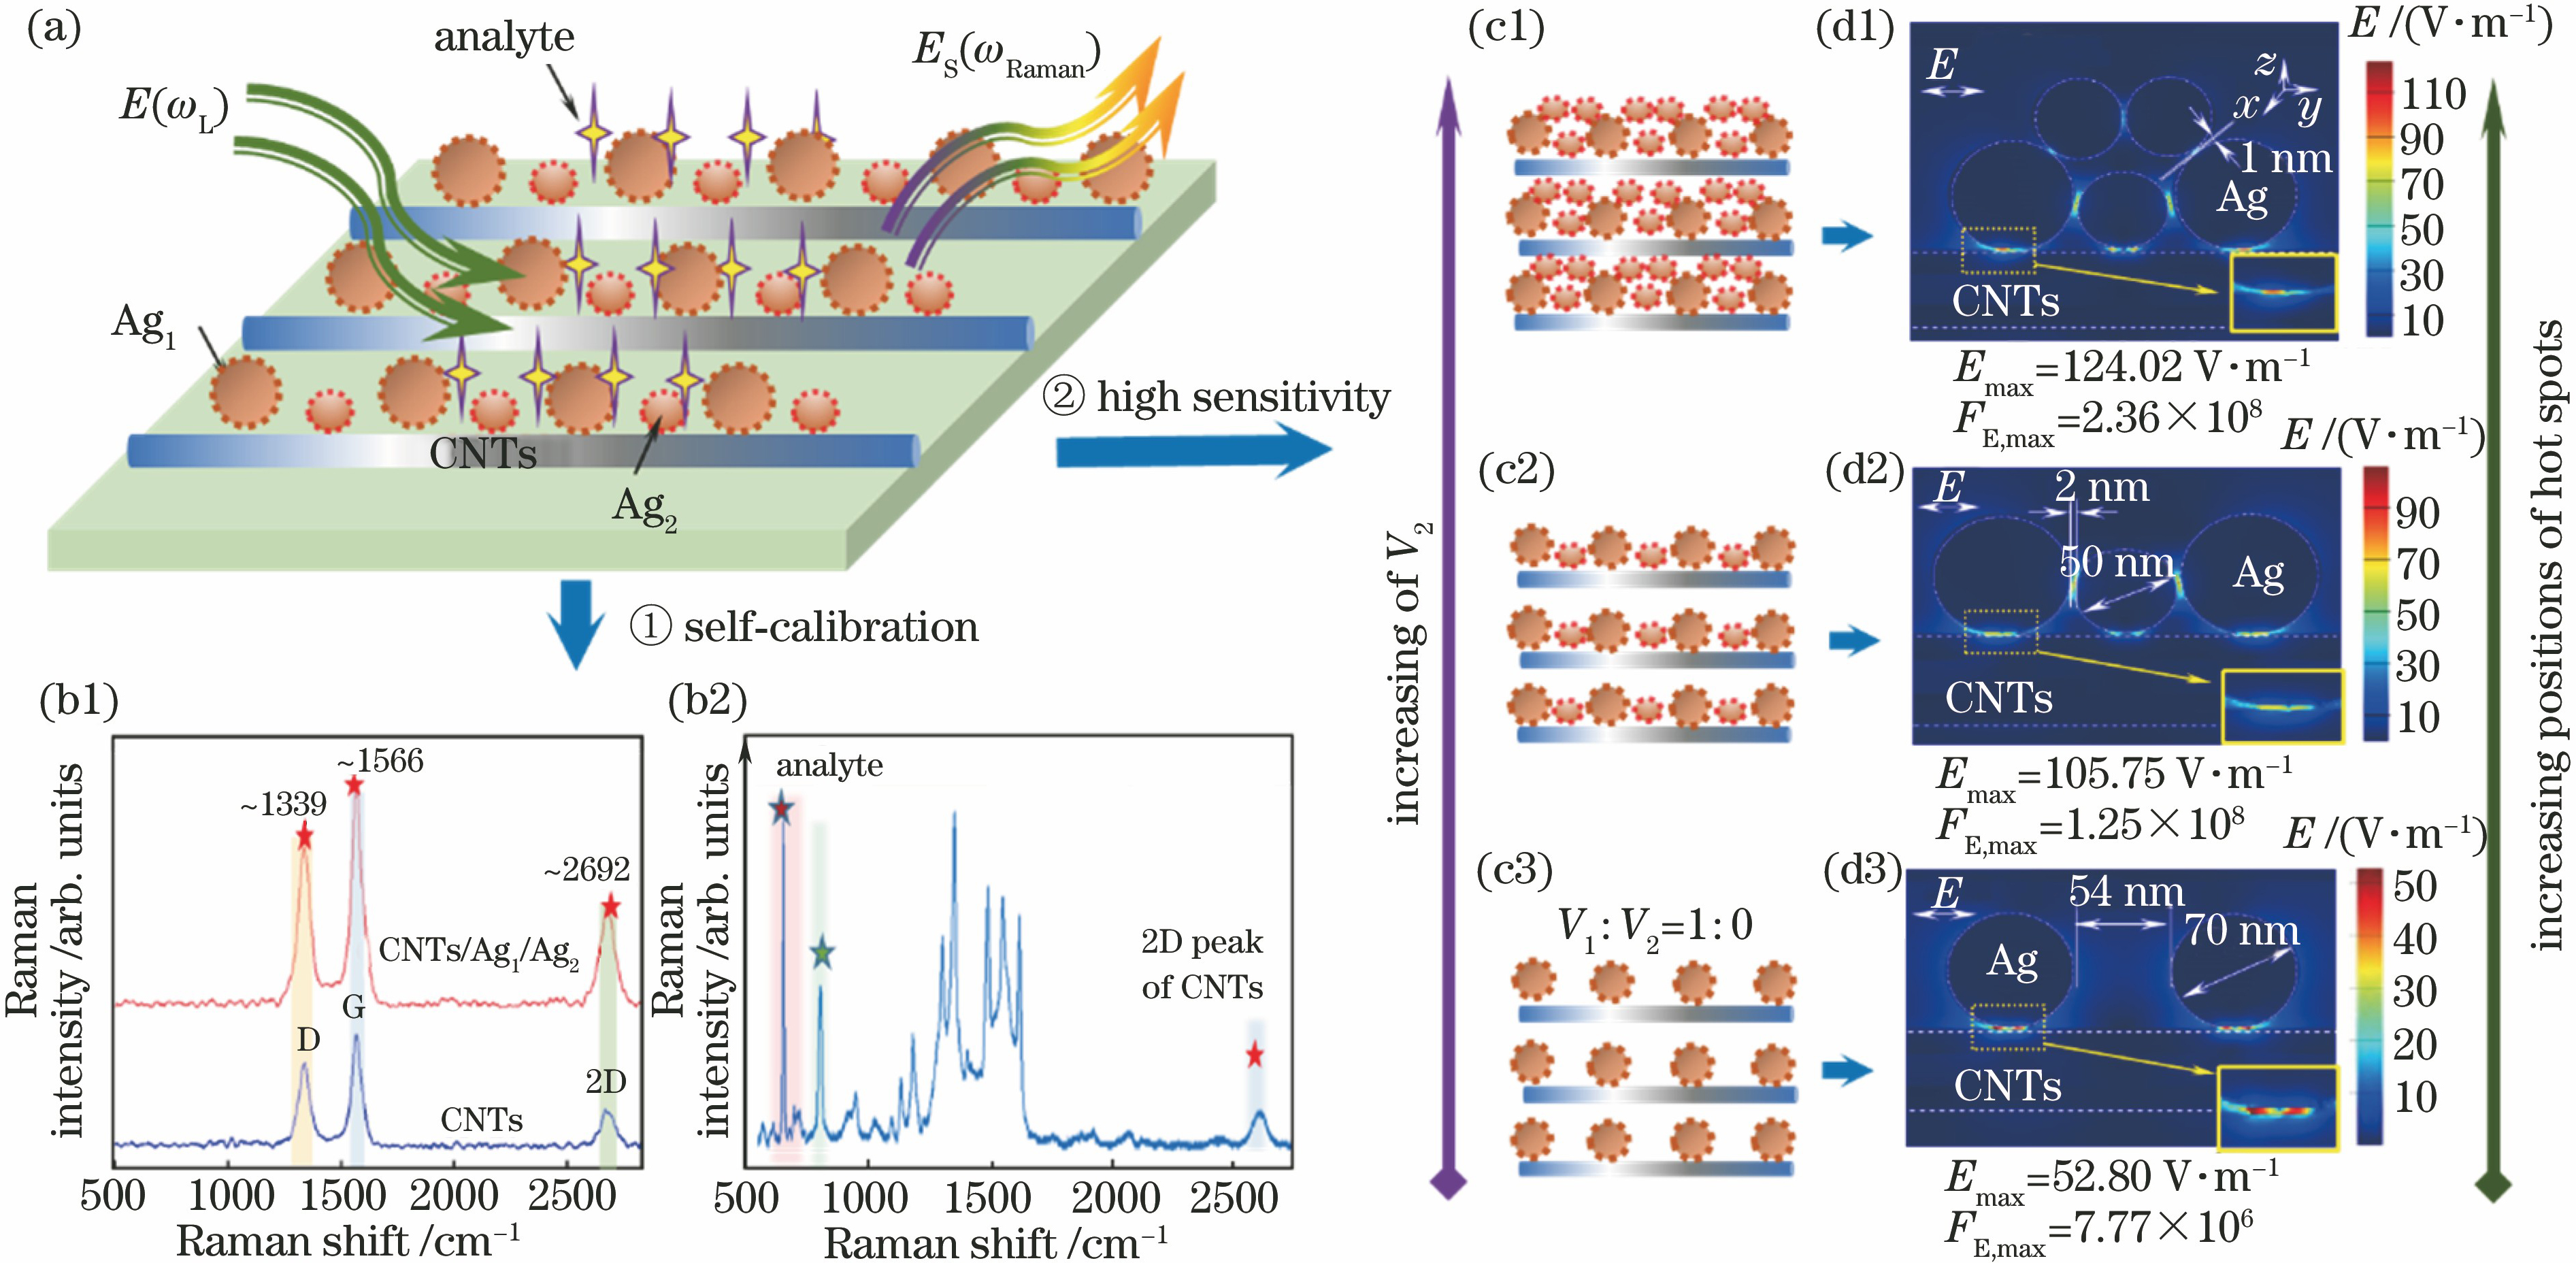
Fig. 2. Schematic of CNTs/Ag1/Ag2 and FDTD simulation results. (a) Test schematic of CNTs/Ag1/Ag2 composite structure; (b1) Raman spectra of CNTs and CNTs/Ag1/Ag2 composite structure, (b2) Raman spectra of analyte to test; (c1)-(c3) Schematic of simulation structure of AgNPs solution with different volumes; (d1)-(d3) corresponding FDTD simulation results
Fig. 3. Raman measurements of R6G. (a) Average Raman spectra of R6G with different concentrations; (b) Raman mapping data of R6G; (c)(d) relationship between k, Raman intensity, and concentration at 613 cm-1 and 773 cm-1 respectively
Fig. 4. Calculated RSD values at different Raman frequency shifts. (a) 613 cm-1; (b)773 cm-1
Fig. 5. Raman measurement results of CV. (a) Averaged Raman spectra of CV molecules with different concentrations; (b) Calculated RSD values of Raman intensities and k at Raman frequency shift of 803 cm-1 and 915 cm-1

Set citation alerts for the article
Please enter your email address
© Copyright 2018-2021 | Chinese Laser Press. All Rights Reserved 沪ICP备15018463号-20