• Photonics Research
  • Vol. 12, Issue 1, 163 (2024)
Runlin Miao1, Ke Yin2、3, Chao Zhou4, Chenxi Zhang3, Zhuopei Yu3, Xin Zheng1, and Tian Jiang5、*
Author Affiliations
  • 1National Innovation Institute of Defense Technology, Academy of Military Sciences PLA China, Beijing 100071, China
  • 2Beijing Institute for Advanced Study, National University of Defense Technology, Beijing 100000, China
  • 3College of Advanced Interdisciplinary Studies, National University of Defense Technology, Changsha 410073, China
  • 4College of Electronic Science and Technology, National University of Defense Technology, Changsha 410073, China
  • 5Institute for Quantum Science and Technology, College of Science, National University of Defense Technology, Changsha 410073, China
  • show less
    DOI: 10.1364/PRJ.507227 Cite this Article Set citation alerts
    Runlin Miao, Ke Yin, Chao Zhou, Chenxi Zhang, Zhuopei Yu, Xin Zheng, Tian Jiang. Dual-microcomb generation via a monochromatically pumped dual-mode microresonator[J]. Photonics Research, 2024, 12(1): 163 Copy Citation Text show less
    Principle and numerical simulations for dual-microcomb generation with the dual-mode scheme. (a) Theory illustration for dual-microcomb generation with a single pump and two adjacent modes (TE00 mode and TE10 mode), in which the C-resonance (C-res.) corresponds to the CW component and the S-resonance (S-res.) corresponds to the soliton component. (b) and (c) are simulated intracavity field evolutions of TE00 mode and TE10 mode, respectively, without the photo-thermal effect. (d) Numerical simulation of the intracavity powers of TE00 mode, TE10 mode, and the total without the photo-thermal effect, showing the formation of dual-microcomb. (e), (f) Numerical simulations of the intracavity power evolutions (blue) of single-mode (e) without or (f) with the photo-thermal effect. (f) Temperature-induced resonance frequency variation is indicated by the red line. (g) and (h) are simulated intracavity field evolutions of TE00 mode and TE10 mode, respectively, with the photo-thermal effect. (i) Numerical simulations of the intracavity powers and temperature-induced resonance frequency variations of TE00 mode, TE10 mode, and the total with the photo-thermal effect. The simulations reveal the soliton step extension of TE00 mode utilizing the dual-mode scheme.
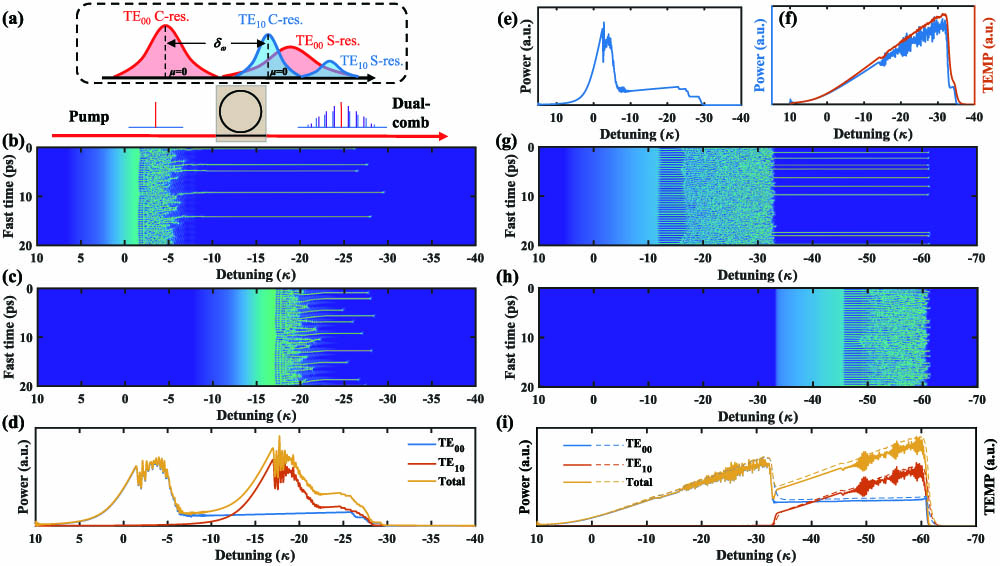
    Fig. 1. Principle and numerical simulations for dual-microcomb generation with the dual-mode scheme. (a) Theory illustration for dual-microcomb generation with a single pump and two adjacent modes (TE00 mode and TE10 mode), in which the C-resonance (C-res.) corresponds to the CW component and the S-resonance (S-res.) corresponds to the soliton component. (b) and (c) are simulated intracavity field evolutions of TE00 mode and TE10 mode, respectively, without the photo-thermal effect. (d) Numerical simulation of the intracavity powers of TE00 mode, TE10 mode, and the total without the photo-thermal effect, showing the formation of dual-microcomb. (e), (f) Numerical simulations of the intracavity power evolutions (blue) of single-mode (e) without or (f) with the photo-thermal effect. (f) Temperature-induced resonance frequency variation is indicated by the red line. (g) and (h) are simulated intracavity field evolutions of TE00 mode and TE10 mode, respectively, with the photo-thermal effect. (i) Numerical simulations of the intracavity powers and temperature-induced resonance frequency variations of TE00 mode, TE10 mode, and the total with the photo-thermal effect. The simulations reveal the soliton step extension of TE00 mode utilizing the dual-mode scheme.
    Dual-microcomb generation experimental setups and characterization. (a) Schematic of the experimental setup. The inset shows a microscope image of one fabricated Si3N4 microresonator chip. AWG, arbitrary waveform generator; EDFA, erbium-doped fiber amplifier; BPF, band-pass filter; TEC, thermoelectric cooler; FBG, fiber Bragg grating; PD, photodetector; OSA, optical spectrum analyzer; OSC, oscilloscope. (b) Transmission spectrum of the microresonator used for dual-microcomb generation. The blue and red lines are measured data for TE00 and TE10 modes, respectively. (c) and (d) are experimentally measured dispersion profiles Dint of TE00 and TE10 modes, respectively. The blue circles are the measured data, and the red lines are the fitting curves.
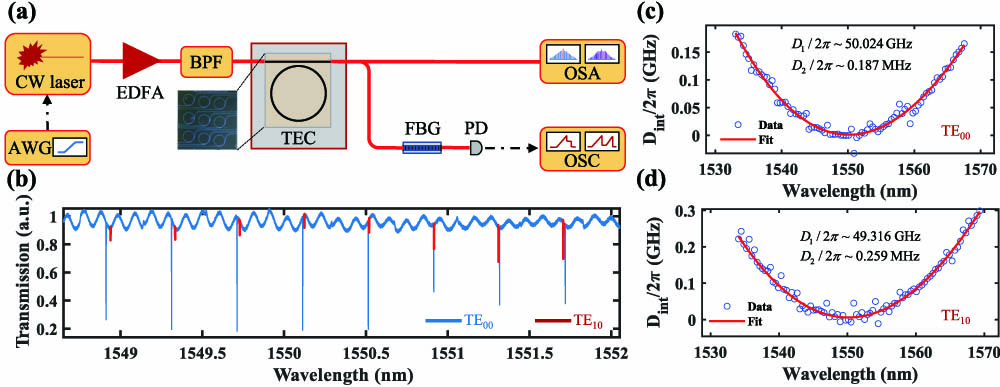
    Fig. 2. Dual-microcomb generation experimental setups and characterization. (a) Schematic of the experimental setup. The inset shows a microscope image of one fabricated Si3N4 microresonator chip. AWG, arbitrary waveform generator; EDFA, erbium-doped fiber amplifier; BPF, band-pass filter; TEC, thermoelectric cooler; FBG, fiber Bragg grating; PD, photodetector; OSA, optical spectrum analyzer; OSC, oscilloscope. (b) Transmission spectrum of the microresonator used for dual-microcomb generation. The blue and red lines are measured data for TE00 and TE10 modes, respectively. (c) and (d) are experimentally measured dispersion profiles Dint of TE00 and TE10 modes, respectively. The blue circles are the measured data, and the red lines are the fitting curves.
    Soliton existence range extension through pumping dual adjacent modes. (a) Measured transmission spectrum of TE00 and TE10 modes for the pump near 1550.12 nm. (b) Microresonator loss results of TE00 mode (left) and TE10 mode (right), respectively. The blue dots and red lines are the measured results and Lorentzian fits. (c) and (d) are observed soliton steps versus scan time or laser tuning frequency for pumping single-mode and dual-mode, respectively. The inset in (c) is the enlarged soliton step. The soliton existence range is increased obviously from (c) 1.7 MHz to (d) 740 MHz. The frequency-coordinate of (c) and (d) was calibrated by a fiber ring with an FSR of ∼33 MHz.
    Fig. 3. Soliton existence range extension through pumping dual adjacent modes. (a) Measured transmission spectrum of TE00 and TE10 modes for the pump near 1550.12 nm. (b) Microresonator loss results of TE00 mode (left) and TE10 mode (right), respectively. The blue dots and red lines are the measured results and Lorentzian fits. (c) and (d) are observed soliton steps versus scan time or laser tuning frequency for pumping single-mode and dual-mode, respectively. The inset in (c) is the enlarged soliton step. The soliton existence range is increased obviously from (c) 1.7 MHz to (d) 740 MHz. The frequency-coordinate of (c) and (d) was calibrated by a fiber ring with an FSR of 33  MHz.
    Single-soliton microcomb generation through slow temperature tuning. (a) Microcomb power trace and (b) chip temperature variation under cooling and heating conditions, respectively. The discrete steps suggest different soliton states.
    Fig. 4. Single-soliton microcomb generation through slow temperature tuning. (a) Microcomb power trace and (b) chip temperature variation under cooling and heating conditions, respectively. The discrete steps suggest different soliton states.
    Experimental soliton results. (a) Collected powers of microcombs for N=0-, 1-, 2-, 3-, 4-soliton states of 50 GHz mode spacing at Pin=310 mW. ①, ②, ③, ④ represent different frequency positions for dual-microcomb generation. (b) Principle of the dual-microcomb generation when considering the microcavity thermal effect. (c)–(f) Optical spectra for N=1-, 2-, 3-, 4-soliton states at ① position. The red lines show a fitted sech2 envelope (single-soliton) and a fitted 2-soliton envelope type, respectively. The inset of (d) shows the relative soliton position. (g) Statistics of soliton numbers with 30 repeated microcomb excitation processes at Pin=310 mW, 325 mW, and 380 mW, respectively.
    Fig. 5. Experimental soliton results. (a) Collected powers of microcombs for N=0-, 1-, 2-, 3-, 4-soliton states of 50 GHz mode spacing at Pin=310  mW. ①, ②, ③, ④ represent different frequency positions for dual-microcomb generation. (b) Principle of the dual-microcomb generation when considering the microcavity thermal effect. (c)–(f) Optical spectra for N=1-, 2-, 3-, 4-soliton states at ① position. The red lines show a fitted sech2 envelope (single-soliton) and a fitted 2-soliton envelope type, respectively. The inset of (d) shows the relative soliton position. (g) Statistics of soliton numbers with 30 repeated microcomb excitation processes at Pin=310  mW, 325 mW, and 380 mW, respectively.
    Dual-microcomb spectra and RF beat notes. (a)–(c) Different dual-microcomb optical spectra at ② (single-soliton and primary comb), ③ (single-soliton and secondary comb), and ④ (single-soliton and chaotic comb) positions, respectively. (d) RF noise spectra of the soliton and dual-microcomb. The photodiode noise floor is overlapped by that of the single soliton. (e) and (f) are corresponding 15.5 GHz heterodyne beat notes of the two adjacent lines of the dual-microcomb at ② and ④ positions, respectively.
    Fig. 6. Dual-microcomb spectra and RF beat notes. (a)–(c) Different dual-microcomb optical spectra at ② (single-soliton and primary comb), ③ (single-soliton and secondary comb), and ④ (single-soliton and chaotic comb) positions, respectively. (d) RF noise spectra of the soliton and dual-microcomb. The photodiode noise floor is overlapped by that of the single soliton. (e) and (f) are corresponding 15.5 GHz heterodyne beat notes of the two adjacent lines of the dual-microcomb at ② and ④ positions, respectively.
    Runlin Miao, Ke Yin, Chao Zhou, Chenxi Zhang, Zhuopei Yu, Xin Zheng, Tian Jiang. Dual-microcomb generation via a monochromatically pumped dual-mode microresonator[J]. Photonics Research, 2024, 12(1): 163
    Download Citation