Author Affiliations
1College of Electronics and Information Engineering, Xi′an Technological University, Xi′an 710021, Shaanxi, China2School of Science, Xi′an Technological University, Xi′an 710021, Shaanxi, China3Key Laboratory of Advanced Technologies of Materials, Ministry of Education, Southwest Jiaotong University, Chengdu 610031, Sichuan, Chinashow less
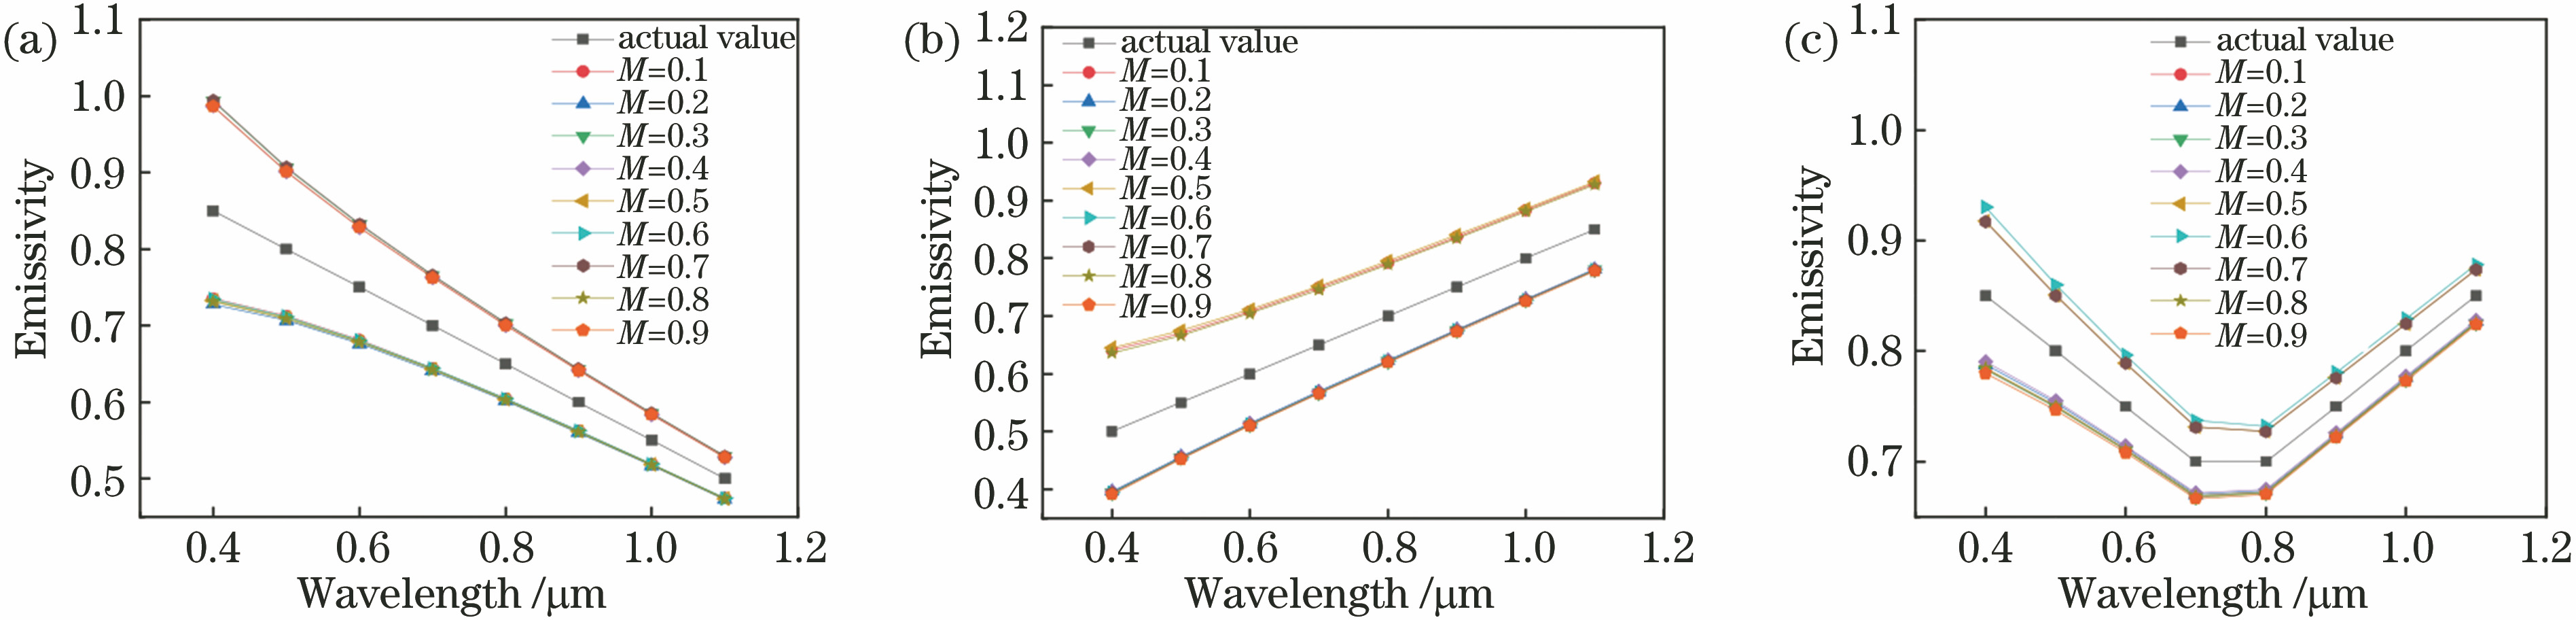
Fig. 1. Emissivity of three models with different values of M. (a) Model A; (b) model B; (c) model C
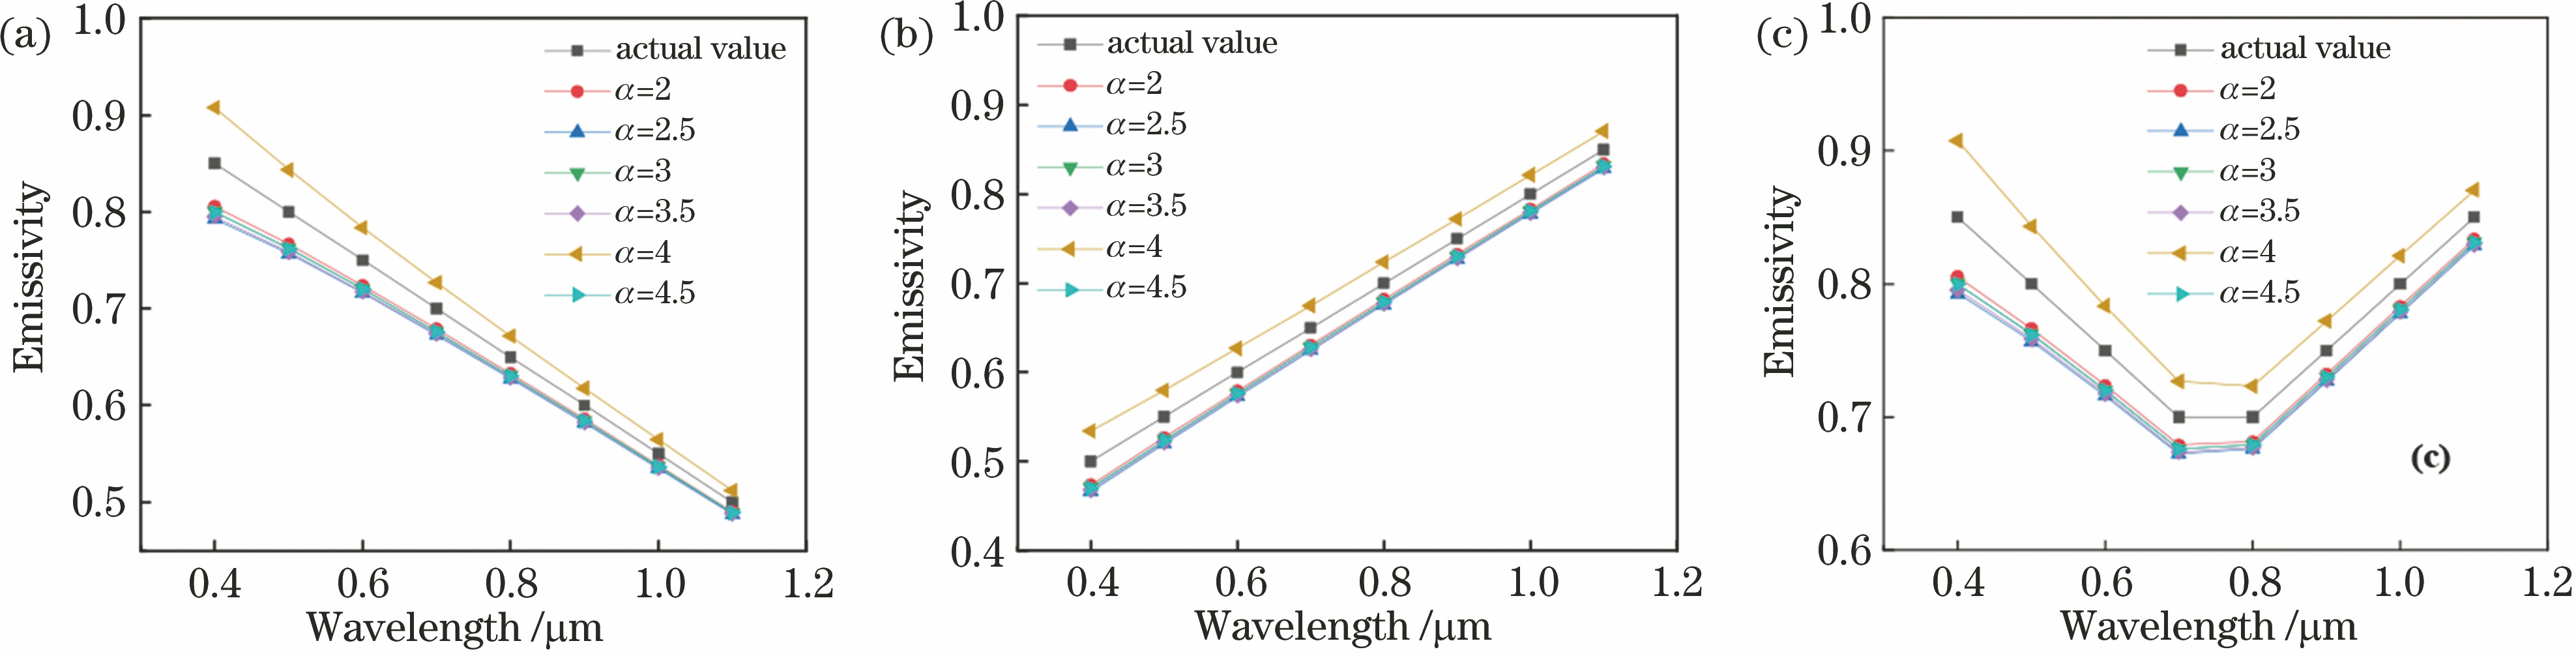
Fig. 2. Emissivity of three models with different values of α. (a) Model A; (b) model B; (c) model C
Fig. 3. Emissivity of three models with different values of w. (a) Model A; (b) model B; (c) model C
Fig. 4. Emissivity of three models with different values of c1 and c2. (a) Model A; (b) model B; (c) model C
Fig. 5. Combined algorithm flow diagram
Fig. 6. Emissivity of model A obtained by different algorithms. (a) Sample temperature is 2000 K; (b) sample temperature is 2030 K; (c) sample temperature is 2060 K
Fig. 7. Emissivity of model B obtained by different algorithms. (a) Sample temperature is 2000 K; (b) sample temperature is 2030 K; (c) sample temperature is 2060 K
Fig. 8. Emissivity of model C obtained by different algorithms. (a) Sample temperature is 2000 K; (b) sample temperature is 2030 K; (c) sample temperature is 2060 K
Fig. 9. Schematic diagram of shock radiation temperature measurement experiment system
Fig. 10. Radiation intensity of sapphire under shock
Fig. 11. Relationship between radiation temperature and pressure of sapphire
| Time | t1 | t2 | t3 | t4 | t5 | t6 |
|---|
| Temperature /K | 3255.4 | 3415.4 | 3532.0 | 3656.3 | 3649.8 | 3624.0 |
|
Table 1. 0 Temperature inversion results at different time
| Sample | 0.4 nm | 0.5 nm | 0.6 nm | 0.7 nm | 0.8 nm | 0.9 nm | 1 nm | 1.1 nm |
|---|
| A | 0.85 | 0.80 | 0.75 | 0.70 | 0.65 | 0.60 | 0.55 | 0.50 | | B | 0.50 | 0.55 | 0.60 | 0.65 | 0.70 | 0.75 | 0.80 | 0.85 | | C | 0.85 | 0.80 | 0.75 | 0.70 | 0.70 | 0.75 | 0.80 | 0.85 |
|
Table 1. Emissivity model of matter
| Sample | M=0.1 | M=0.2 | M=0.3 | M=0.4 | M=0.5 | M=0.6 | M=0.7 | M=0.8 | M=0.9 |
|---|
| A | 2016.31 | 2017.42 | 1982.83 | 1983.56 | 2016.71 | 2016.37 | 1982.74 | 2016.91 | 1983.57 | | B | 1972.83 | 2026.23 | 2026.87 | 2026.13 | 1972.03 | 2026.62 | 2026.92 | 1973.60 | 2027.52 | | C | 2009.04 | 2008.54 | 2009.20 | 2008.15 | 1991.54 | 1991.54 | 1991.54 | 2008.95 | 2009.65 |
|
Table 2. Temperature inversion results of three models with different values of MK
| Sample | 2 | 2.5 | 3 | 3.5 | 4 | 4.5 |
|---|
| A | 2015.15 | 1984.11 | 2014.61 | 1985.88 | 1984.77 | 2015.18 | | B | 1967.40 | 2033.94 | 1966.74 | 1967.68 | 2032.56 | 2033.46 | | C | 2006.01 | 2007.79 | 2006.77 | 2007.44 | 1992.73 | 2006.85 |
|
Table 3. Temperature inversion results of three models with different values of αK
| Sample | Fixed value w | Linear iteration value w | Improved iterative value w |
|---|
| A | 2037.1 | 2027.6 | 2016.6 | | B | 2043.6 | 1951.2 | 1961.3 | | C | 2020.1 | 2003.6 | 2003.1 |
|
Table 4. Inversion temperature results of three models with different values of wK
| Sample | Fixed values c1 and c2 | Improved iterative values c1 and c2 |
|---|
| A | 2034.1 | 2026.7 | | B | 1950.4 | 1970.1 | | C | 2043.8 | 2035.2 |
|
Table 5. Temperature inversion results of three models with different values of c1 and c2K
| Channel No. | 1 | 2 | 3 | 4 | 5 | 6 | 7 | 8 |
|---|
| Wavelength /μm | 0.4 | 0.5 | 0.6 | 0.7 | 0.8 | 0.9 | 1.0 | 1.1 |
|
Table 6. Effective wavelengths of 8 channels
| Sample | 1 | 2 | 3 | 4 | 5 | 6 | 7 | 8 |
|---|
| A1 | 0.85 | 0.80 | 0.75 | 0.70 | 0.65 | 0.60 | 0.55 | 0.50 | | A2 | 0.85 | 0.83 | 0.81 | 0.79 | 0.77 | 0.75 | 0.73 | 0.71 | | A3 | 0.80 | 0.75 | 0.70 | 0.65 | 0.60 | 0.55 | 0.50 | 0.45 | | A4 | 0.80 | 0.78 | 0.76 | 0.74 | 0.72 | 0.70 | 0.68 | 0.66 | | A5 | 0.75 | 0.70 | 0.65 | 0.60 | 0.55 | 0.50 | 0.45 | 0.40 | | A6 | 0.75 | 0.73 | 0.71 | 0.69 | 0.67 | 0.65 | 0.63 | 0.61 | | A7 | 0.70 | 0.65 | 0.60 | 0.55 | 0.50 | 0.45 | 0.40 | 0.35 | | A8 | 0.70 | 0.68 | 0.66 | 0.64 | 0.62 | 0.60 | 0.58 | 0.56 | | A9 | 0.65 | 0.60 | 0.55 | 0.50 | 0.45 | 0.40 | 0.35 | 0.30 | | B1 | 0.50 | 0.55 | 0.60 | 0.65 | 0.70 | 0.75 | 0.80 | 0.85 | | B2 | 0.71 | 0.73 | 0.75 | 0.77 | 0.79 | 0.81 | 0.83 | 0.85 | | B3 | 0.45 | 0.50 | 0.55 | 0.60 | 0.65 | 0.70 | 0.75 | 0.80 | | B4 | 0.66 | 0.68 | 0.70 | 0.72 | 0.74 | 0.76 | 0.78 | 0.80 | | B5 | 0.40 | 0.45 | 0.50 | 0.55 | 0.60 | 0.65 | 0.70 | 0.75 | | B6 | 0.61 | 0.63 | 0.65 | 0.67 | 0.69 | 0.71 | 0.73 | 0.75 | | B7 | 0.35 | 0.40 | 0.45 | 0.50 | 0.55 | 0.60 | 0.65 | 0.70 | | B8 | 0.56 | 0.58 | 0.60 | 0.62 | 0.64 | 0.66 | 0.68 | 0.70 | | B9 | 0.30 | 0.35 | 0.40 | 0.45 | 0.50 | 0.55 | 0.60 | 0.65 | | C1 | 0.85 | 0.80 | 0.75 | 0.70 | 0.70 | 0.75 | 0.80 | 0.85 | | C2 | 0.80 | 0.78 | 0.76 | 0.74 | 0.76 | 0.78 | 0.80 | 0.82 | | C3 | 0.78 | 0.76 | 0.74 | 0.72 | 0.70 | 0.72 | 0.74 | 0.76 | | C4 | 0.76 | 0.74 | 0.72 | 0.70 | 0.68 | 0.70 | 0.72 | 0.74 | | C5 | 0.75 | 0.70 | 0.65 | 0.60 | 0.65 | 0.70 | 0.75 | 0.80 | | C6 | 0.74 | 0.72 | 0.70 | 0.68 | 0.66 | 0.68 | 0.70 | 0.72 | | C7 | 0.72 | 0.70 | 0.68 | 0.66 | 0.68 | 0.70 | 0.72 | 0.74 | | C8 | 0.70 | 0.68 | 0.66 | 0.64 | 0.62 | 0.64 | 0.66 | 0.68 | | C9 | 0.68 | 0.66 | 0.64 | 0.62 | 0.60 | 0.62 | 0.64 | 0.66 |
|
Table 7. Emissivity samples of 8 channels
| Emissivity model | Reference temperature /K | Least squares method | BP neural network | IPSO-multiplier penalty function | | |
|---|
| Temperature /K | Relative error /% | Temperature /K | Relative error /% | Temperature /K | Relative error /% |
|---|
| A1 | | 1943.75 | -2.8125 | 2032.31 | 1.61550 | 2022.21 | 1.1105000 | | B1 | 2000 | 1961.49 | -1.9255 | 2020.43 | 1.02150 | 2007.43 | 0.3715000 | | C1 | | 1979.20 | -1.0400 | 2042.25 | 2.11250 | 2041.34 | 2.0670000 | | A1 | | 1926.64 | -5.0916 | 2052.07 | 1.08719 | 2053.04 | 1.1349754 | | B1 | 2030 | 1954.46 | -3.7212 | 2036.25 | 0.30788 | 2037.62 | 0.3753695 | | C1 | | 1982.25 | -2.3522 | 2062.71 | 1.61133 | 2047.73 | 0.8733990 | | A1 | | 1951.92 | -5.2466 | 2074.75 | 0.71602 | 2073.72 | 0.6660194 | | B1 | 2060 | 1980.49 | -3.8597 | 2054.28 | -0.27770 | 2067.18 | 0.3485437 | | C1 | | 2009.03 | -2.4743 | 2086.01 | 1.26262 | 2048.05 | -1.0655340 |
|
Table 8. Temperature inversion results of three models obtained by three methods
| Time | Radiation intensity of different wavelength |
|---|
| 0.488 μm | 0.509 μm | 0.533 μm | 0.589 μm | 0.650 μm | 0.702 μm | 0.779 μm | 0.809 μm |
|---|
| t1 | 0.516 | 0.554 | 0.664 | 0.688 | 0.764 | 0.695 | 0.715 | 0.650 | | t2 | 0.801 | 0.923 | 0.109 | 0.115 | 0.125 | 1.140 | 1.180 | 1.090 | | t3 | 1.160 | 1.250 | 1.420 | 1.650 | 1.710 | 1.660 | 1.630 | 1.480 | | t4 | 1.510 | 1.700 | 2.020 | 2.220 | 2.370 | 2.300 | 2.260 | 2.110 | | t5 | 1.770 | 2.130 | 2.480 | 2.800 | 3.000 | 2.840 | 2.970 | 2.672 | | t6 | 2.040 | 2.390 | 2.820 | 3.250 | 3.580 | 3.500 | 3.560 | 3.320 |
|
Table 9. Radiation intensity of 8 channels at different time1011 W·m-3·Sr-1