
Yu He, Yunhua Yao, Yilin He, Zhengqi Huang, Dalong Qi, Chonglei Zhang, Xiaoshuai Huang, Kebin Shi, Pengpeng Ding, Chengzhi Jin, Lianzhong Deng, Zhenrong Sun, Xiaocong Yuan, Shian Zhang, "Untrained neural network enhances the resolution of structured illumination microscopy under strong background and noise levels," Adv. Photon. Nexus 2, 046005 (2023)
- Advanced Photonics Nexus
- Vol. 2, Issue 4, 046005 (2023)
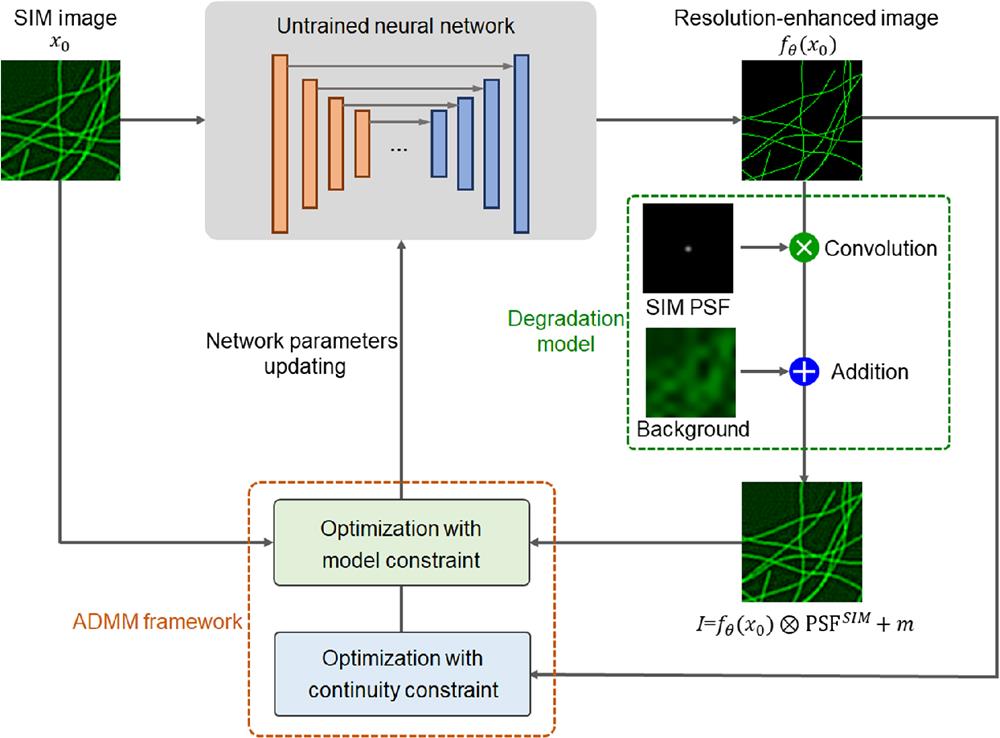
Fig. 1. Flow chart of ADMM-DRE-SIM for realizing the resolution enhancement of SIM.
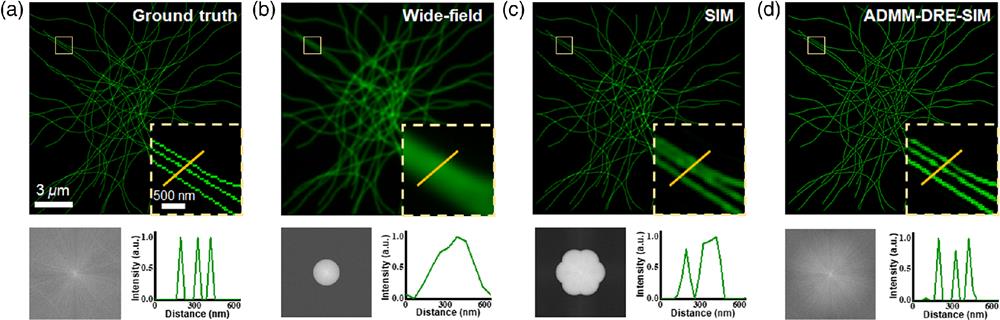
Fig. 2. Simulation results for the resolution enhancement of SIM by ADMM-DRE-SIM. (a) The ground truth, (b) wide-field, (c) SIM, and (d) ADMM-DRE-SIM images of the simulated structures, associated with the corresponding frequency spectra and intensity distributions along the labeled lines in the insets. The insets are the enlarged views of the selected areas with yellow squares.
Fig. 3. Simulation results for the effects of background and noise levels on the resolution enhancement of SIM by various algorithms. (a) The ground truth, wide-field, SIM, and ADMM-DRE-SIM images of the simulated structures without the background and noise. (b) The SIM, Wiener deconvolution, RLTV deconvolution, Hessian deconvolution, and ADMM-DRE-SIM images with a uniform background combined with Gaussian noise
Fig. 4. Experimental results for the resolution enhancement of SIM by ADMM-DRE-SIM. (a) The wide-field, SIM, and ADMM-DRE-SIM images of tubulins in MEF cells and (c) actins in NIH/3T3 cells, together with the corresponding intensity distributions along the labeled lines in the insets. The FRCs of the SIM and ADMM-DRE-SIM images for (b) tubulins and (d) actins.
Fig. 5. Experimental results for the effects of the strong background and low SNR on the resolution enhancement of SIM by various algorithms. (a) SIM image of tubulins with strong background. Left, the stitched image with the SIM image on the top and the ADMM-DRE-SIM image on the bottom; right, the enlarged SIM image marked with the yellow square and the images processed by RL, RLTV, Hessian, sparse deconvolution, and ADMM-DRE-SIM algorithms, respectively. (b) SIM image of tubulins with low SNR. The image arrangement is the same as (a).
Fig. 6. Comparison of ADMM-DRE-SIM and modified ADMM-DRE-SIM in structural fidelity. (a) SIM image of tubulins; (b) estimated background map; (c) image by directly subtracting the estimated background map from the SIM image. (d)–(g) The SIM, background subtracted SIM, modified ADMM-DRE-SIM, and ADMM-DRE-SIM images for the selected area marked with the yellow square, respectively.
Fig. 7. Experimental results for the resolution enhancement of SIM by ADMM-DRE-SIM with


Set citation alerts for the article
Please enter your email address

© Copyright 2018-2021 | Chinese Laser Press. All Rights Reserved 沪ICP备15018463号-20