Author Affiliations
1State Key Laboratory of Hydro-science and Engineering, Tsinghua University, Beijing 100084, China2State Key Laboratory of Hydraulic Engineering Simulation and Safety, Tianjin University, Tianjin 300072, Chinashow less
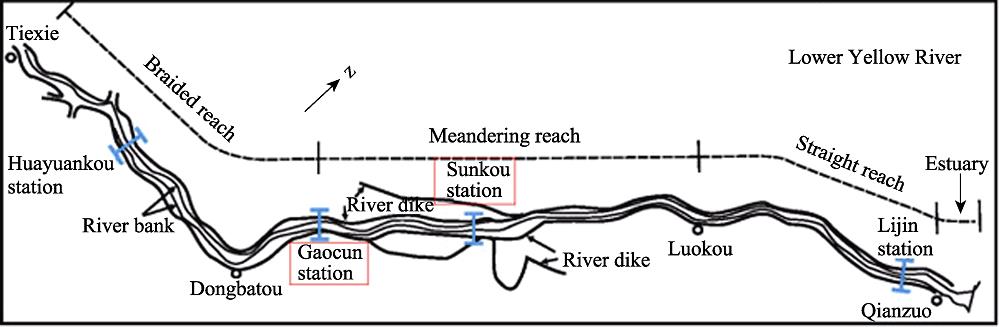
Fig. 1. The Gaocun-Sunkou reach of the Lower Yellow River
Fig. 2. Comparison of the calculated and measured values of bankfull channel geometries in the Gaocun-Sunkou reach of the Lower Yellow River under the Model-1 condition
Fig. 3. Comparison of the calculated and measured values of bankfull channel geometries in the Gaocun-Sunkou reach of the Lower Yellow River under the Model-2 condition
Fig. 4. Comparison of the calculated and measured values of bankfull channel geometries in the Gaocun-Sunkou reach of the Lower Yellow River under the Model-3 condition
Fig. 5. The time-varying process of effective probabilistic stability thickness of hydraulic geometry in the Gaocun-Sunkou reach of the Lower Yellow River under the three model conditions
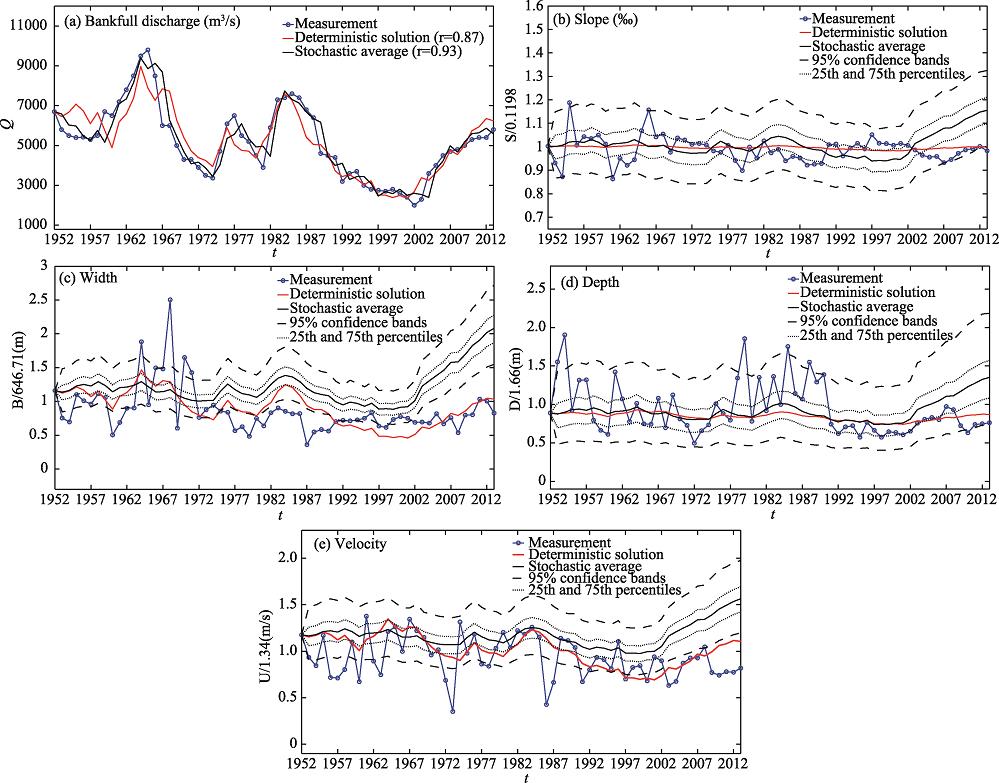
Fig. 6. Comparison of stochastic average with measurements in the Gaocun-Sunkou reach of the Lower Yellow River under the three model conditions
Fig. 7. The time-varying probability distribution of riverbed stability indices, hydraulic width/depth ratio and stream power in the Gaocun-Sunkou reach of the Lower Yellow River based on Fractional Jump-Diffusion model (13)
| Year | Flood season’s average value (*) | Bankfull discharge Q (m3/s) | Slope S (‰) | Width B (m) | Depth D (m) | Velocity U (m/s) |
|---|
| DischargeQf (m3/s) | IS coefficient
$\xi_{f}$(kg·s/m6)
|
|---|
| 1952 | 2417.073 | 0.0080 | 6700 | 0.120 | 750 | 1.48 | 1.57 | | 1953 | 2562.967 | 0.0153 | 5800 | 0.112 | 487.5 | 2.58 | 1.25 | | 1954 | 3531.862 | 0.0132 | 5500 | 0.104 | 450 | 3.17 | 1.13 | | 1955 | 3218.593 | 0.0095 | 5400 | 0.142 | 711.5 | 1.54 | 1.57 | | 1956 | 2673.740 | 0.0154 | 5420 | 0.121 | 652 | 2.19 | 0.96 | | 1957 | 1838.984 | 0.0197 | 5300 | 0.125 | 620.8 | 2.20 | 0.95 | | 1958 | 4190.626 | 0.0123 | 5500 | 0.124 | 719.5 | 1.32 | 1.07 | | 1959 | 2070.854 | 0.0356 | 6700 | 0.126 | 684 | 1.10 | 1.47 | | 1960 | 1092.754 | 0.0343 | 6500 | 0.121 | 325.5 | 1.02 | 0.90 | | 1961 | 2729.593 | 0.0061 | 7200 | 0.103 | 445 | 2.37 | 1.84 | | 1962 | 2232.033 | 0.0079 | 7800 | 0.114 | 581 | 1.78 | 1.20 | | 1963 | 2926.106 | 0.0065 | 8500 | 0.110 | 584 | 1.30 | 1.00 | | 1964 | 4969.268 | 0.0052 | 9500 | 0.113 | 1217.5 | 1.69 | 1.62 | | 1965 | 1534.878 | 0.0123 | 9800 | 0.128 | 614 | 1.24 | 1.69 | | 1966 | 2898.642 | 0.0176 | 8500 | 0.139 | 967 | 1.24 | 1.34 | | 1967 | 4232.683 | 0.0091 | 6000 | 0.125 | 957.5 | 1.80 | 1.80 | | 1968 | 3114.821 | 0.0110 | 6000 | 0.126 | 1618.8 | 1.16 | 1.63 | | 1969 | 1155.35 | 0.0378 | 5000 | 0.117 | 390 | 1.87 | 1.54 | | 1970 | 1675.976 | 0.0359 | 4300 | 0.124 | 1067 | 1.35 | 1.28 | | 1971 | 1385.22 | 0.0336 | 4300 | 0.123 | 922.5 | 1.21 | 1.36 | | 1972 | 1205.667 | 0.0223 | 3900 | 0.121 | 493.5 | 0.83 | 0.92 | | 1973 | 1938.841 | 0.0282 | 3500 | 0.121 | 566.6 | 1.09 | 0.47 | | 1974 | 1164.151 | 0.0271 | 3370 | 0.121 | 610.5 | 1.22 | 1.76 | | 1975 | 3035.675 | 0.0115 | 4710 | 0.118 | 553.5 | 1.68 | 1.31 | | 1976 | 3137.325 | 0.0088 | 6090 | 0.117 | 542 | 1.47 | 1.59 | | 1977 | 1627.472 | 0.0419 | 6500 | 0.121 | 366.1 | 1.32 | 1.15 | | 1978 | 1949.756 | 0.0262 | 5500 | 0.113 | 404.5 | 2.23 | 1.12 | | 1979 | 1945.122 | 0.0199 | 5200 | 0.108 | 312.1 | 3.09 | 1.38 | | 1980 | 1183.447 | 0.0225 | 4500 | 0.120 | 483.5 | 1.30 | 1.61 | | 1981 | 3011.618 | 0.0114 | 3900 | 0.114 | 412.7 | 2.25 | 1.39 | | 1982 | 2226.911 | 0.0094 | 5900 | 0.123 | 538 | 1.53 | 1.64 | | 1983 | 3310.407 | 0.0063 | 7300 | 0.117 | 583.7 | 2.27 | 1.58 | | 1984 | 3127.667 | 0.0070 | 7400 | 0.118 | 551.5 | 1.66 | 1.68 | | 1985 | 2298.691 | 0.0110 | 7600 | 0.113 | 527.5 | 2.92 | 1.54 | | 1986 | 1207.065 | 0.0138 | 7400 | 0.115 | 529.5 | 1.90 | 0.57 | | 1987 | 694.1382 | 0.0216 | 6800 | 0.114 | 233.1 | 1.78 | 0.89 | | 1988 | 1915.215 | 0.0244 | 6400 | 0.110 | 353.5 | 2.58 | 1.53 | | 1989 | 1796.545 | 0.0156 | 4600 | 0.111 | 376.5 | 2.15 | 1.49 | | 1990 | 1233.398 | 0.0217 | 4500 | 0.111 | 363.2 | 2.31 | 1.39 | | 1991 | 429.735 | 0.0523 | 4400 | 0.121 | 453.5 | 1.24 | 0.90 | | 1992 | 1168.78 | 0.0383 | 3200 | 0.121 | 465 | 1.03 | 1.07 | | 1993 | 1285.764 | 0.0207 | 3600 | 0.115 | 460 | 1.18 | 1.25 | | 1994 | 1221.439 | 0.0394 | 3700 | 0.119 | 469 | 1.20 | 1.22 | | 1995 | 1013.087 | 0.0465 | 3000 | 0.122 | 486 | 0.96 | 1.09 | | 1996 | 1357.556 | 0.0232 | 2800 | 0.119 | 537.5 | 1.27 | 1.48 | | 1997 | 299.5125 | 0.1589 | 2750 | 0.126 | 410.5 | 1.10 | 0.94 | | 1998 | 899 | 0.0366 | 2700 | 0.122 | 398 | 0.95 | 1.10 | | 1999 | 779.2927 | 0.0468 | 2800 | 0.121 | 474 | 1.07 | 1.13 | | 2000 | 443.1463 | 0.0161 | 2600 | 0.121 | 500.5 | 1.06 | 0.91 | | 2001 | 321.3228 | 0.0232 | 2400 | 0.121 | 486 | 1.01 | 1.26 | | 2002 | 714.4472 | 0.0148 | 2000 | 0.120 | 446 | 1.08 | 1.20 | | 2003 | 1300.414 | 0.0113 | 2300 | 0.118 | 448.5 | 1.26 | 0.84 | | 2004 | 818.2926 | 0.0239 | 3600 | 0.115 | 439 | 1.34 | 0.90 | | 2005 | 897.536 | 0.0104 | 4000 | 0.115 | 528 | 1.38 | 1.17 | | 2006 | 806.008 | 0.0079 | 4500 | 0.115 | 431.5 | 1.33 | 1.24 | | 2007 | 1140.674 | 0.0059 | 4700 | 0.112 | 491 | 1.62 | 1.24 | | 2008 | 625.040 | 0.0095 | 4800 | 0.113 | 347.5 | 1.55 | 1.40 | | 2009 | 646.455 | 0.0041 | 5000 | 0.116 | 515 | 1.21 | 1.03 | | 2010 | 1166.422 | 0.0045 | 5300 | 0.118 | 518.5 | 1.05 | 0.99 | | 2011 | 934.065 | 0.0051 | 5400 | 0.119 | 668 | 1.23 | 1.04 | | 2012 | 1438.495 | 0.0057 | 5400 | 0.120 | 648.5 | 1.24 | 1.04 | | 2013 | 1219.894 | 0.0076 | 5800 | 0.118 | 533.5 | 1.27 | 1.10 |
|
Table 1. Flood season’s average discharge, suspended sediment concentration, and annual measured bankfull channel geometries along the Gaocun station downwards
| Estimate | K | b | c | $ \beta$ | ${{\sigma }_{1}}$ | $\gamma $ |
|---|
| Mean | 76.495 | -0.477 | 0.299 | 0.213 | 0.136 | 0.582 | | SD | 23.833 | 0.044 | 0.027 | 0.018 | 0.005 | 0.047 |
|
Table 2. The estimated results of the unknown parameters set for the SDEs-Eq.(8a)
| Estimate | Slope (S) | Width (B) | Depth (D) | Velocity (U) |
|---|
| m | Mean | 0.184 | 0.771 | 0.560 | 0.424 | | SD | 0.038 | 0.218 | 0.092 | 0.068 | | ${{\sigma }_{2}}$ | Mean | 0.073 | 0.143 | 0.276 | 0.130 | | SD | 0.148 | 0.047 | 0.069 | 0.023 |
|
Table 3. The estimated results of the unknown parameters set for the SDEs-Eq.(8b)
| Estimate | K | b | c | $\beta $ | ${{\sigma }_{1}}$ | $\gamma $ | $\lambda _{u}^{[1]} $ | $\lambda _{d}^{[1]} $ | $1/\eta _{u}^{\left[ 1 \right]} $ | $1/\eta _{d}^{[1]} $ |
|---|
| Mean | 23.818 | -0.505 | 0.432 | 0.312 | 0.118 | 0.494 | 0.030 | 0.020 | 0.215 | 0.573 | | SD | 4.795 | 0.025 | 0.018 | 0.002 | 0.003 | 0.003 | 0.001 | 0.004 | 0.016 | 0.047 |
|
Table 4. The estimated results of the unknown parameters set for the jump-diffusion Eq. (10a)
| Estimate | Slope (S) | Width (B) | Depth (D) | Velocity (U) |
|---|
| m | Mean | -0.086 | 0.264 | 0.350 | 0.310 | | SD | 0.009 | 0.043 | 0.059 | 0.046 | | ${{\sigma }_{2}}$ | Mean | 0.075 | 0.301 | 0.300 | 0.160 | | SD | 0.014 | 0.065 | 0.065 | 0.055 | | $\lambda _{u}^{[2]} $ | Mean | 0.180 | 0.300 | 0.311 | 0.394 | | SD | 0.001 | 0.014 | 0.029 | 0.065 | | $\lambda _{d}^{[2]} $ | Mean | 0.180 | 0.300 | 0.327 | 0.426 | | SD | 0.004 | 0.026 | 0.054 | 0.025 | | $1/\eta _{u}^{[2]} $ | Mean | 0.059 | 0.079 | 0.180 | 0.080 | | SD | 0.001 | 0.045 | 0.025 | 0.004 | | $1/\eta _{d}^{[2]} $ | Mean | 0.030 | 0.109 | 0.175 | 0.177 | | SD | 0.009 | 0.068 | 0.027 | 0.062 |
|
Table 5. The estimated results of the unknown parameters set for the jump-diffusion Eq. (10b)
| Estimate | K | b | c | $\beta $ | ${{\sigma }_{1}}$ | $\gamma $ | ${{H}^{[1]}} $ | $\lambda _{u}^{[1]} $ | $\lambda _{d}^{[1]} $ | $1/\eta _{u}^{\left[ 1 \right]} $ | $1/\eta _{d}^{[1]} $ |
|---|
| Mean | 25.14 | -0.52 | 0.42 | 0.29 | 0.11 | 0.23 | 0.55 | 0.09 | 0.06 | 0.04 | 0.15 | | SD | 3.27 | 0.03 | 0.02 | 0.01 | 0.00 | 0.00 | 0.00 | 0.00 | 0.02 | 0.00 | 0.01 |
|
Table 6. The estimated results of the unknown parameters set for the fractional jump-diffusion Eq. (13a)
| Estimate | Slope (S) | Width (B) | Depth (D) | Velocity (U) |
|---|
| m | Mean | -0.141 | 0.704 | 0.350 | 0.880 | | SD | 0.011 | 0.043 | 0.026 | 0.063 | | ${{\sigma }_{2}}$ | Mean | 0.090 | 0.500 | 0.640 | 0.260 | | SD | 0.015 | 0.035 | 0.055 | 0.017 | | ${{H}^{[2]}} $ | Mean | 0.471 | 0.349 | 0.471 | 0.301 | | SD | 0.054 | 0.013 | 0.026 | 0.063 | | $\lambda _{u}^{[2]} $ | Mean | 0.374 | 0.410 | 0.361 | 0.554 | | SD | 0.072 | 0.075 | 0.026 | 0.064 | | $\lambda _{d}^{[2]} $ | Mean | 0.380 | 0.410 | 0.367 | 0.556 | | SD | 0.095 | 0.075 | 0.023 | 0.052 | | $1/\eta _{u}^{[2]} $ | Mean | 0.088 | 0.488 | 0.300 | 0.230 | | SD | 0.041 | 0.048 | 0.011 | 0.033 | | $1/\eta _{d}^{[2]} $ | Mean | 0.087 | 0.453 | 0.105 | 0.170 | | SD | 0.025 | 0.064 | 0.023 | 0.028 |
|
Table 7. The estimated results of the unknown parameters set for the fractional jump-diffusion Eq. (13b)
| Correlation | Zw | $\zeta $ | $\Omega $ | Q |
|---|
| Q | 0.035 | 0.140 | 0.523 | 1 |
|
Table 8. The correlation coefficients of time-varying stochastic average Zw, $\zeta $,$\Omega $ with Q