
Yang Gao, Zhongliang Li, Jianhua Zhang, Nan Nan, Xuan Wang, Xiangzhao Wang. Automatic Measurement Method for Corneal Thickness of Optical Coherence Tomography Images[J]. Acta Optica Sinica, 2019, 39(3): 0311003
- Acta Optica Sinica
- Vol. 39, Issue 3, 0311003 (2019)
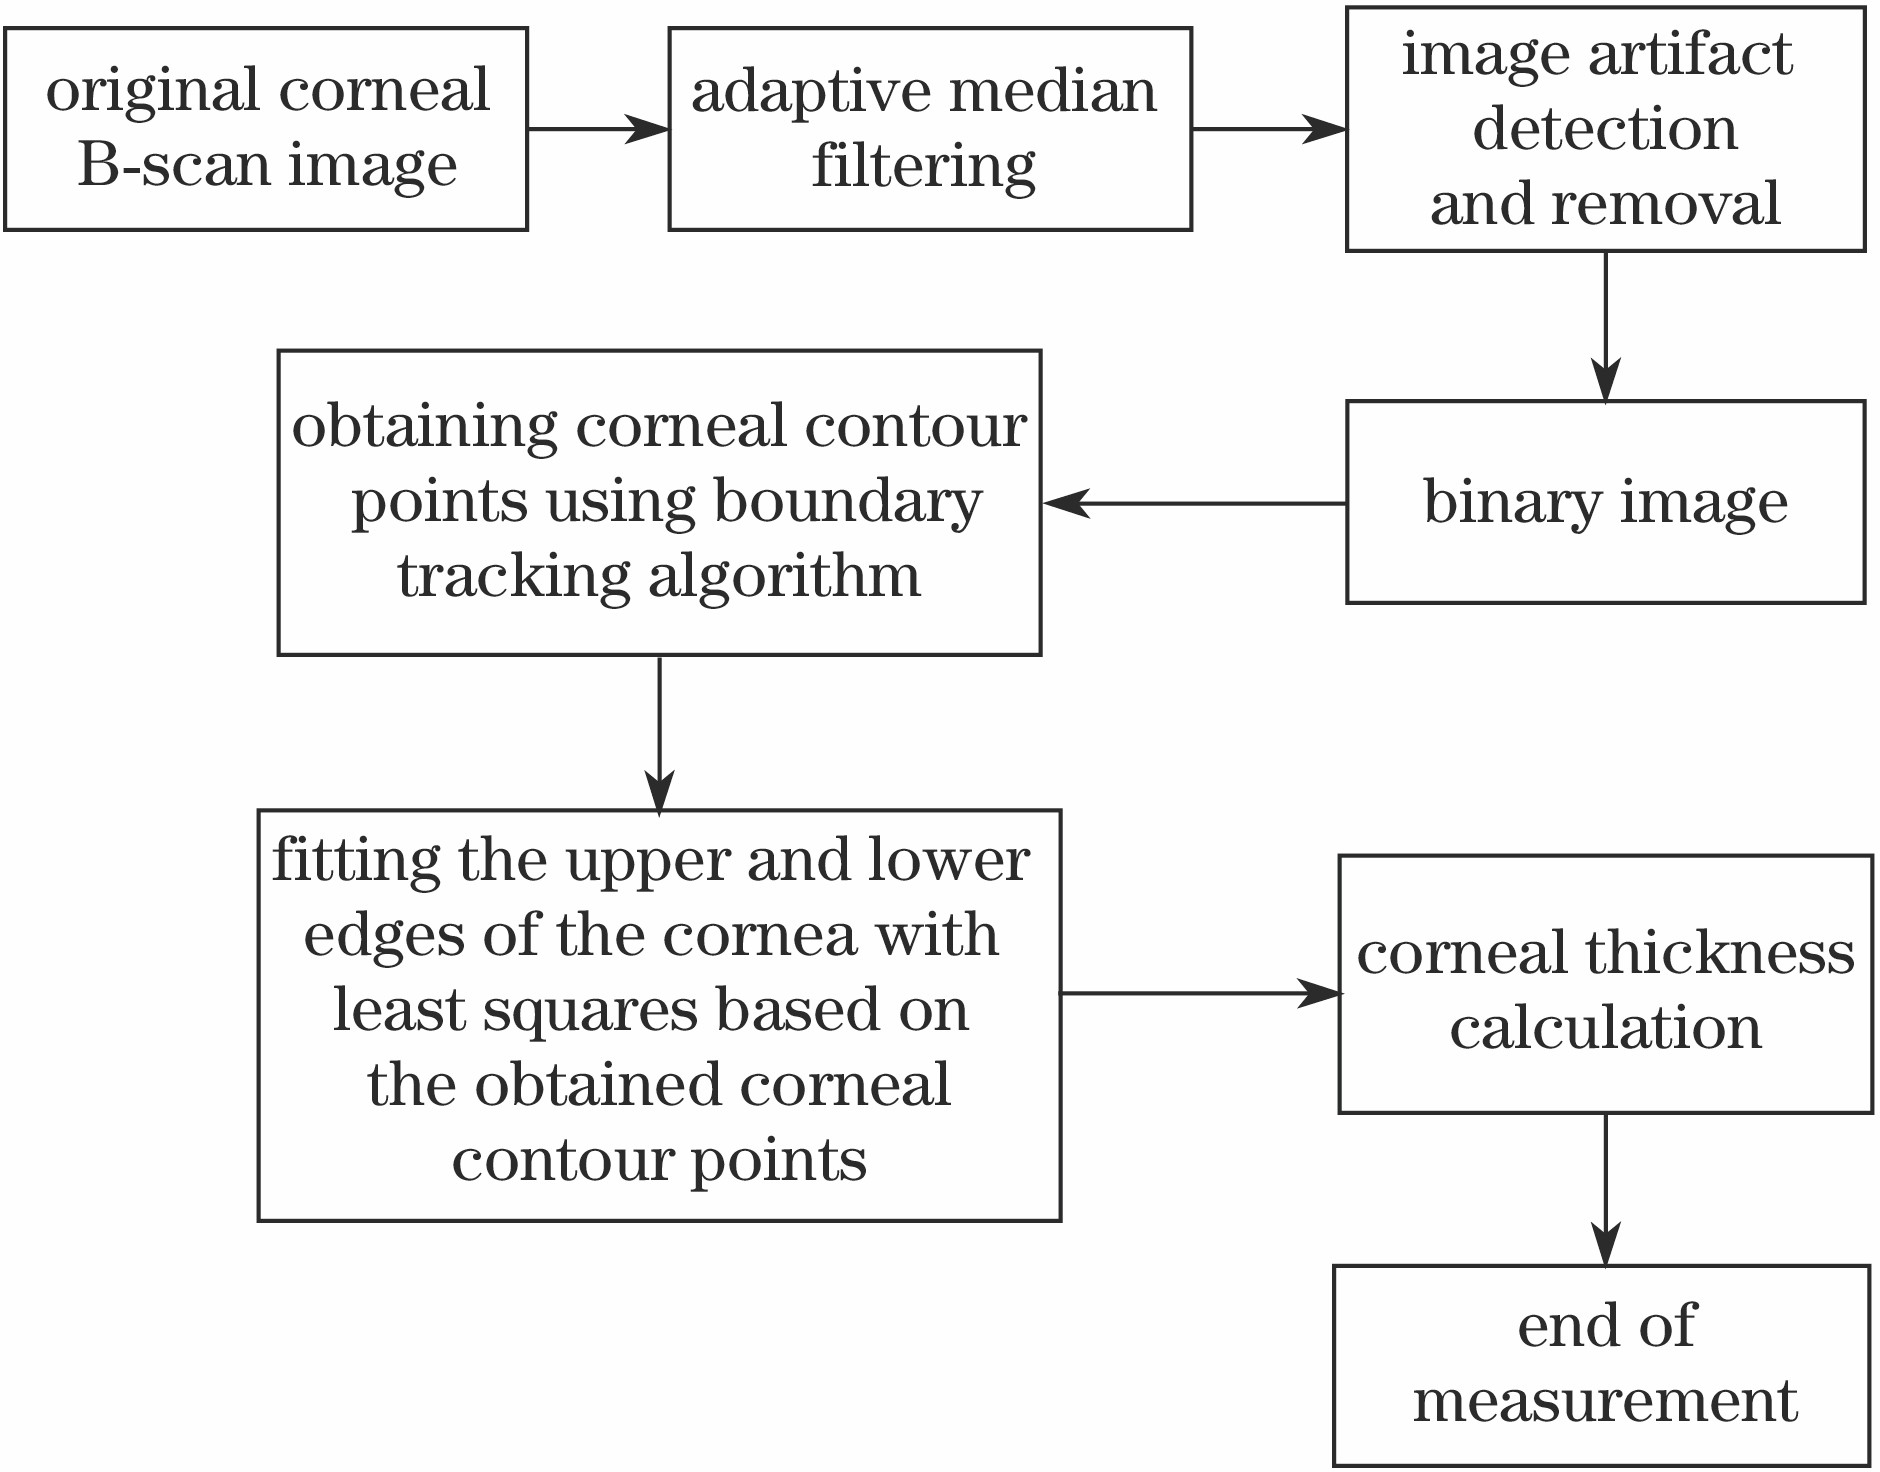
Fig. 1. Flow chart of proposed measurement method of corneal thickness
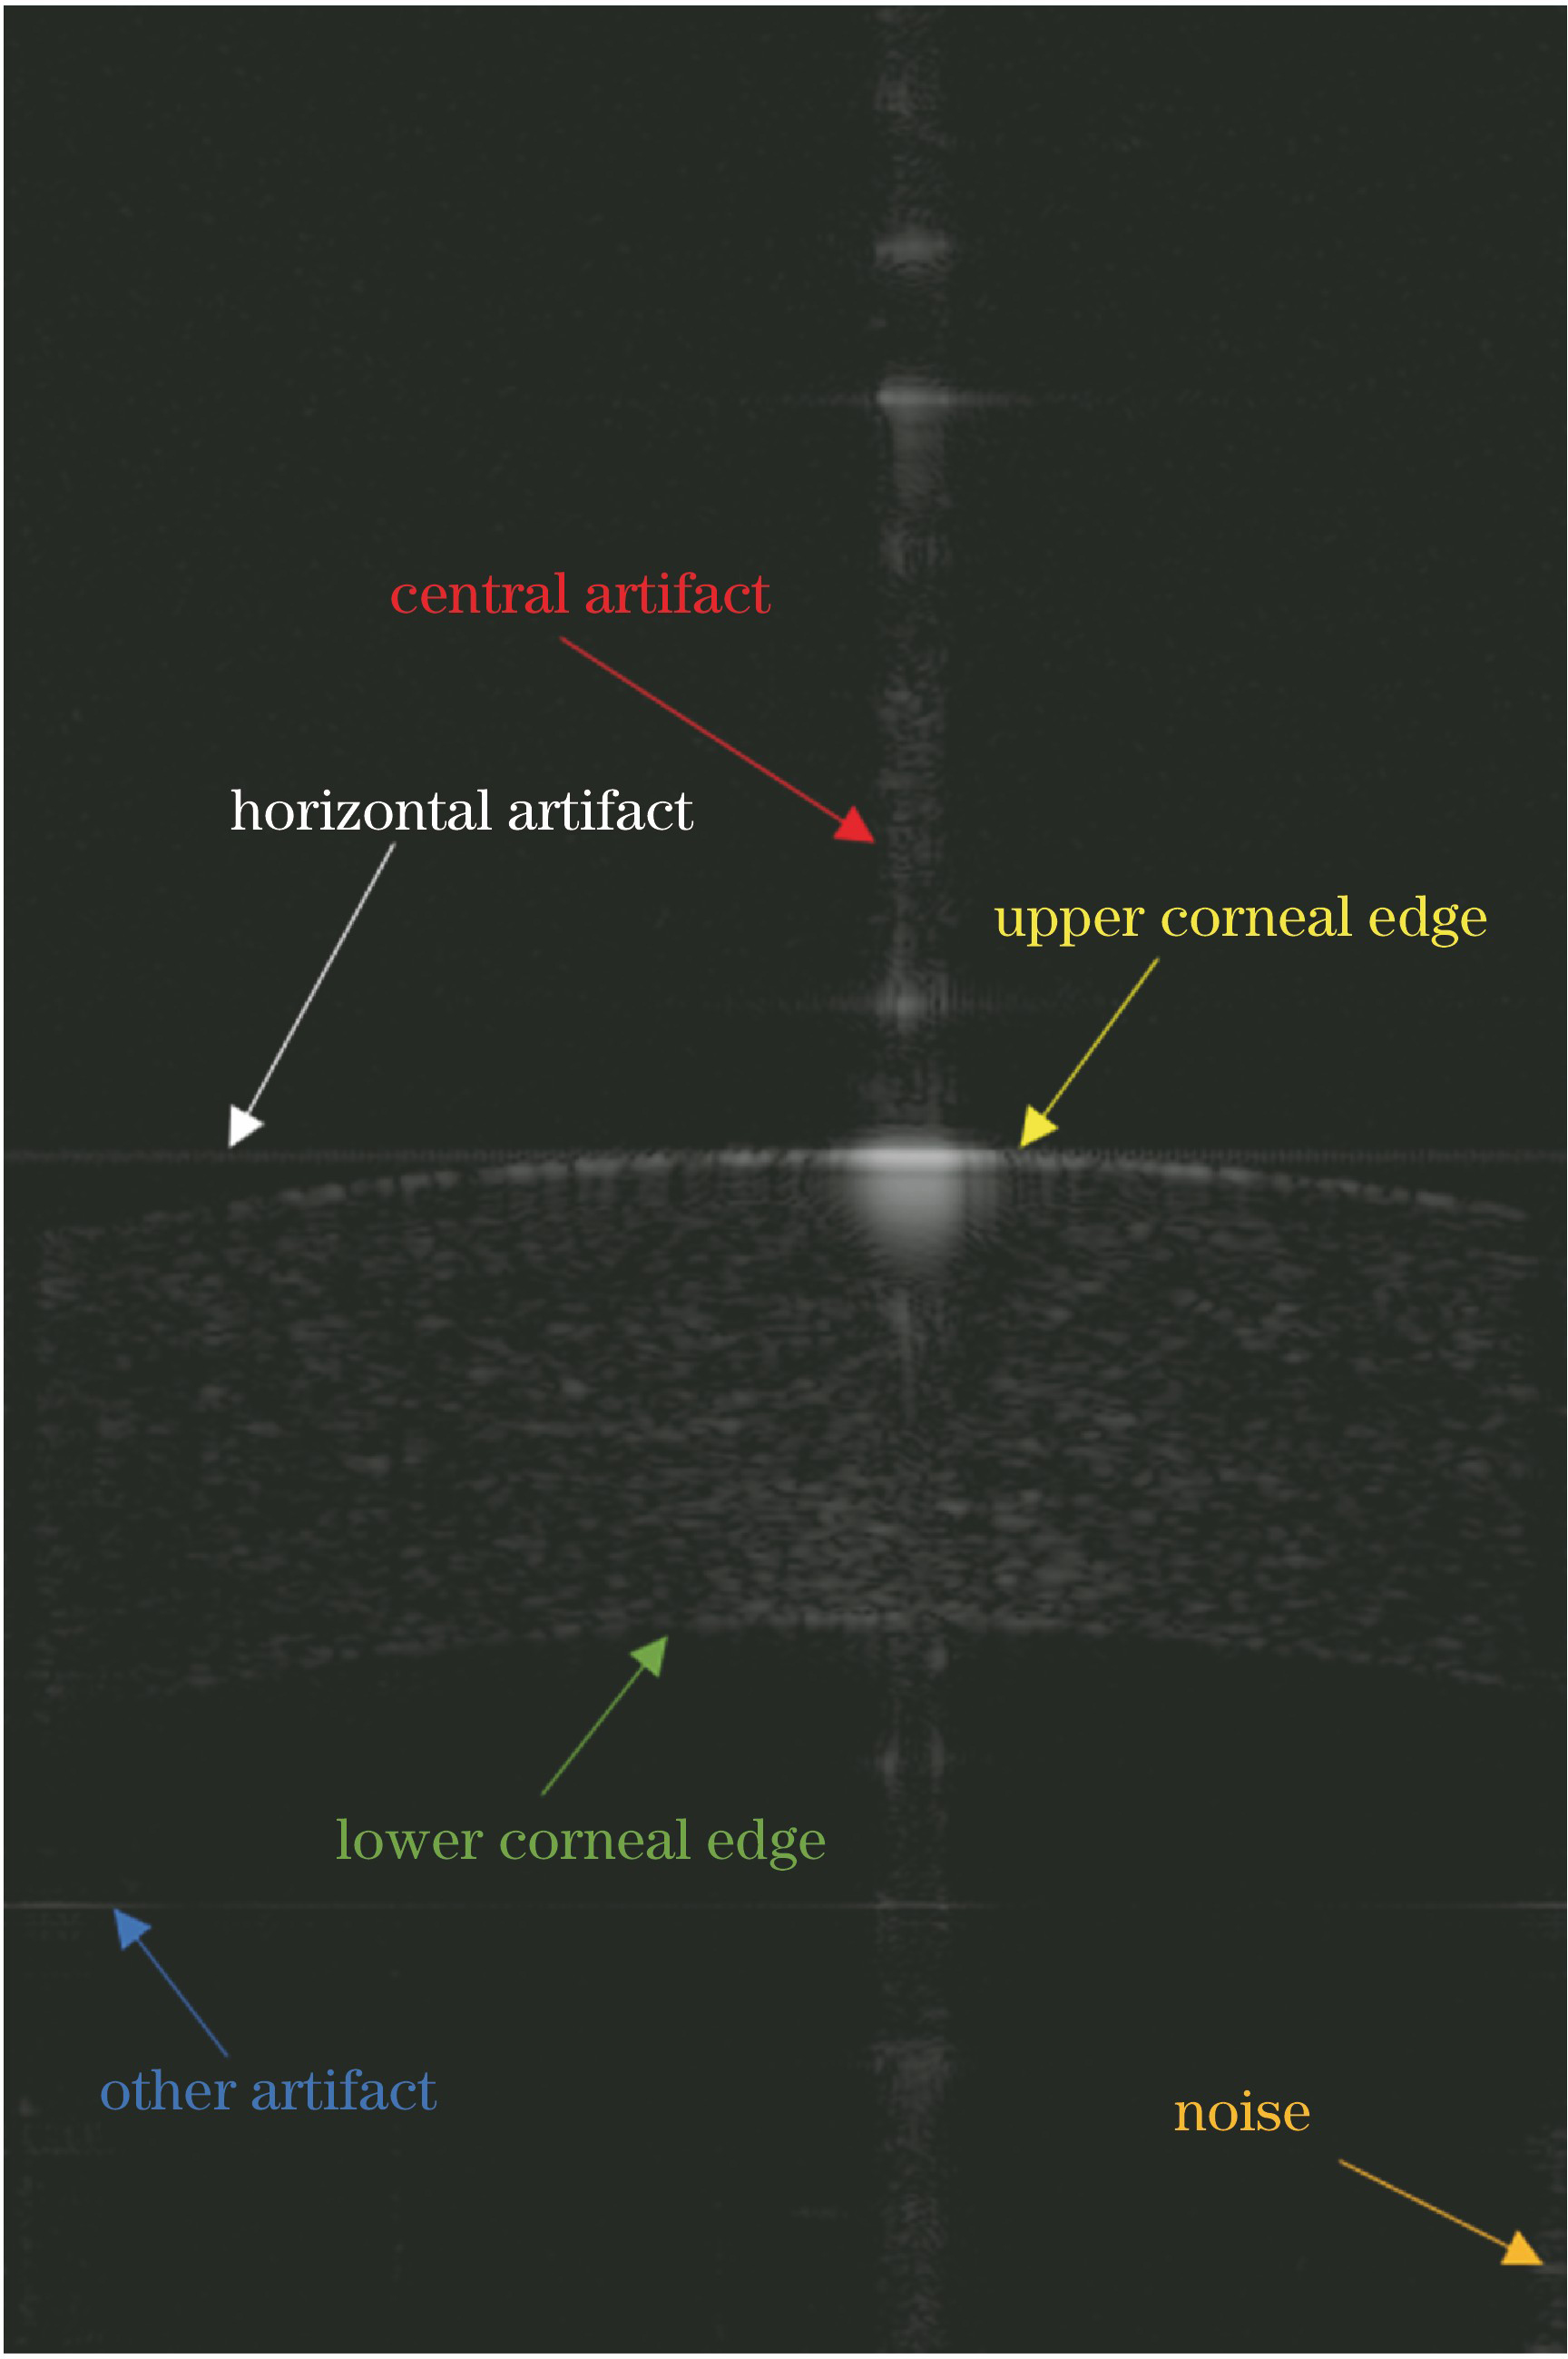
Fig. 2. Noise and artifacts in original cornea B scan image
Fig. 3. A-scan averaged intensity curve
Fig. 4. Average intensity curves of adjacent rows
Fig. 5. Effect of corneal B-scan OCT images after pre-treatment. (a) Original corneal B-scan image; (b) corneal B-scan image with adaptive median-filtering; (c) corneal B-scan image with horizontal artifact removal; (d) corneal B-scan image with suppressed central artifact
Fig. 6. Boundary conditions. (a) Outer boundary condition; (b) hole boundary condition
Fig. 7. Upper and lower edge fitting results of human corneal OCT B-scan image. (a) High quality original corneal B-scan image; (b) high quality edge fitting corneal B-scan image; (c) original corneal B-scan image with noise and artifacts; (d) edge fitting corneal B-scan image with noise and artifacts
Fig. 8. Fitting effects of upper and lower edges of human corneal B-scan images obtained by different pre-processing denoising algorithms. (a) No preprocessing denoising. (b) mean filter preprocessing; (c) median filter preprocessing; (d) adaptive median filter preprocessing
Fig. 9. Results of upper and lower edge fitting of OCT corneal images. (a) Edge detection and random sampling consistency method; (b) proposed method
|
Table 1. Average thickness, central thickness and corresponding standard deviations along Y-axis of corneal images with different qualities
|
Table 2. Average thickness, central thickness and corresponding standard deviations along Y-axis after treatments with different pretreatment algorithms
|
Table 3. Average thickness deviation, corneal center thickness deviation and corresponding standard deviations along Y-axis of corneal by different methods

Set citation alerts for the article
Please enter your email address
© Copyright 2018-2021 | Chinese Laser Press. All Rights Reserved 沪ICP备15018463号-20