• Laser & Optoelectronics Progress
  • Vol. 57, Issue 22, 221101 (2020)
Peng Jiang1, Weixin Wang2, Ning Zhang2、*, Chengming Wang3, Wei Huang2, Gaojun Shi2, Xiaojing Xu2, and Shuhui Gao1、*
Author Affiliations
  • 1School of Forensic Science and investigation, People's Public Security University of China, Beijing 100038, China
  • 2National Engineering Laboratory for Forensic Science, Institute of Forensic Science, Ministry of Public Security, Beijing 100038, China
  • 3State Key Laboratory of Low-Dimensional Quantum Physics, Tsinghua University, Beijing 100084, China
  • show less
    DOI: 10.3788/LOP57.221101 Cite this Article Set citation alerts
    Peng Jiang, Weixin Wang, Ning Zhang, Chengming Wang, Wei Huang, Gaojun Shi, Xiaojing Xu, Shuhui Gao. Preliminary Study on Determining the Sequence of Intersecting Lines Using Optical Coherence Tomography[J]. Laser & Optoelectronics Progress, 2020, 57(22): 221101 Copy Citation Text show less
    Different types of sequence of intersecting lines. (a) JN; (b) NJ; (c) SU; (d) US; (e) PY; (f) YP
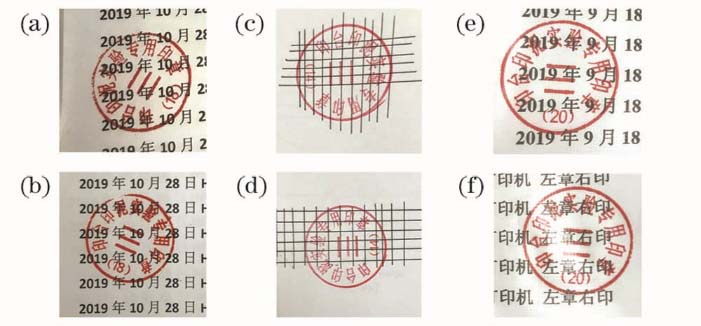
    Fig. 1. Different types of sequence of intersecting lines. (a) JN; (b) NJ; (c) SU; (d) US; (e) PY; (f) YP
    Schematic of frequency domain OCT system
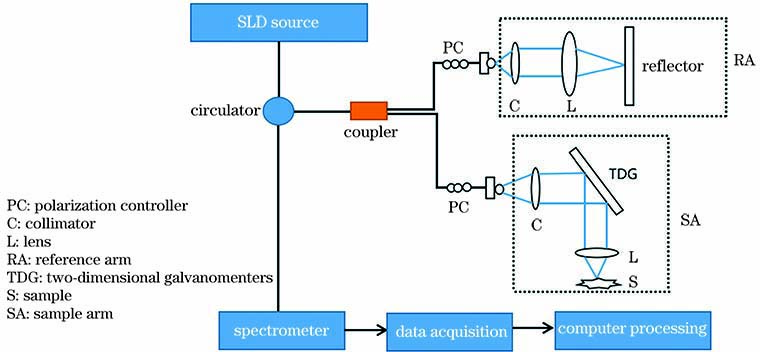
    Fig. 2. Schematic of frequency domain OCT system
    OCT imaging experiment results of NJ and JN samples. (a) NJ photo; (b) JN photo; (c) two-dimensional OCT tomographic image of NJ; (d) two-dimensional OCT tomographic image of JN; (e) longitudinal signal at dotted line in Fig. (c); (f) longitudinal signal at dotted line in Fig. (d)
    Fig. 3. OCT imaging experiment results of NJ and JN samples. (a) NJ photo; (b) JN photo; (c) two-dimensional OCT tomographic image of NJ; (d) two-dimensional OCT tomographic image of JN; (e) longitudinal signal at dotted line in Fig. (c); (f) longitudinal signal at dotted line in Fig. (d)
    OCT imaging experiment results of US and SU samples. (a) US photo; (b) SU photo; (c) two-dimensional OCT tomographic image of US; (d) two-dimensional OCT tomographic image of SU; (e) longitudinal signal at dotted line in Fig. (c); (f) longitudinal signal at dotted line in Fig. (d)
    Fig. 4. OCT imaging experiment results of US and SU samples. (a) US photo; (b) SU photo; (c) two-dimensional OCT tomographic image of US; (d) two-dimensional OCT tomographic image of SU; (e) longitudinal signal at dotted line in Fig. (c); (f) longitudinal signal at dotted line in Fig. (d)
    OCT imaging experiment results of YP and PY samples. (a) YP photo; (b) PY photo; (c) two-dimensional OCT tomographic image of YP; (d) two-dimensional OCT tomographic image of PY
    Fig. 5. OCT imaging experiment results of YP and PY samples. (a) YP photo; (b) PY photo; (c) two-dimensional OCT tomographic image of YP; (d) two-dimensional OCT tomographic image of PY
    Peng Jiang, Weixin Wang, Ning Zhang, Chengming Wang, Wei Huang, Gaojun Shi, Xiaojing Xu, Shuhui Gao. Preliminary Study on Determining the Sequence of Intersecting Lines Using Optical Coherence Tomography[J]. Laser & Optoelectronics Progress, 2020, 57(22): 221101
    Download Citation