
Hui Jin, Ming Zhang, Guopeng Zhou, Xiao Xiao, Yutao Zhu. Phase Error Restraint Method for Fringe Projection Measurement System[J]. Laser & Optoelectronics Progress, 2021, 58(14): 1412001
- Laser & Optoelectronics Progress
- Vol. 58, Issue 14, 1412001 (2021)
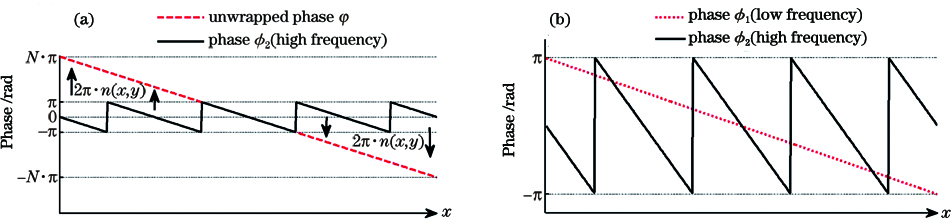
Fig. 1. Sketch maps of phase unwrapping. (a) Wrapped phases ϕ1 and ϕ2; (b) wrapped phase ϕ2 and unwrapped phase φ
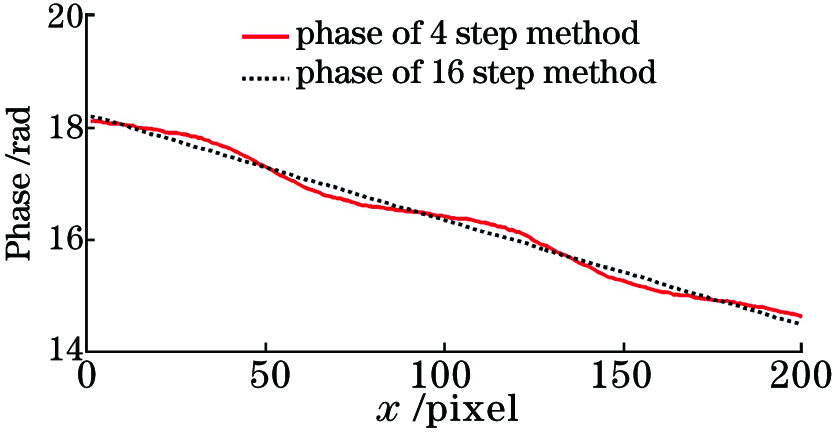
Fig. 2. Unwrapped phases of 4 step method and 16 step method
Fig. 3. Error of unwrapped phase of 4 step method
Fig. 4. Mean filtering templates. (a) Normal 3×3 mean filtering template; (b) a kind of one-dimension mean filtering template; (c) mean filtering template to decrease phase error
Fig. 5. New mean filtering templates. (a) Mean filtering template for head of each row of pixels; (b) mean filtering template for end of each row of pixels
Fig. 6. Experimental device and image collection. (a) Experimental device of structure light measurement; (b) projected fringes on background plane; (c) projected fringes on carton
Fig. 7. Frequency spectra. (a) Frequency spectrum of phase error (displayed frequency range is 0--150); (b) frequency spectrum of unwrapped phase obtained by 4 step method (displayed frequency range is 0--150)
Fig. 8. Phase error and restrained phase error of pixels in 100th row
Fig. 9. Three dimensional (3D) point cloud measurement results (height from carton to reference plane). (a) 4 step method; (b) 4 step method with error compensation by LUT method; (c) 4 step method with phase error restraining; (d) 16 step method
Fig. 10. Cross sections of measured 3D point cloud (1500th row). (a) 4 step method; (b) 4 step method with phase error compensation by LUT method; (c) 4 step method with phase error restraining; (d) 16 step method
|
Table 1. Experimental result of phase error restraining
| |||||||||||||||||||||||||||||||||||||||||
Table 2. Statistics of results of 5 phase error restraining experiments

Set citation alerts for the article
Please enter your email address
© Copyright 2018-2021 | Chinese Laser Press. All Rights Reserved 沪ICP备15018463号-20