Author Affiliations
1College of Mechanical Engineering,Quzhou University, Quzhou , Zhejiang 324000, China2Key Laboratory of Air-Driven Equipment Technology of Zhejiang Province, Quzhou University, Quzhou , Zhejiang 324000, Chinashow less
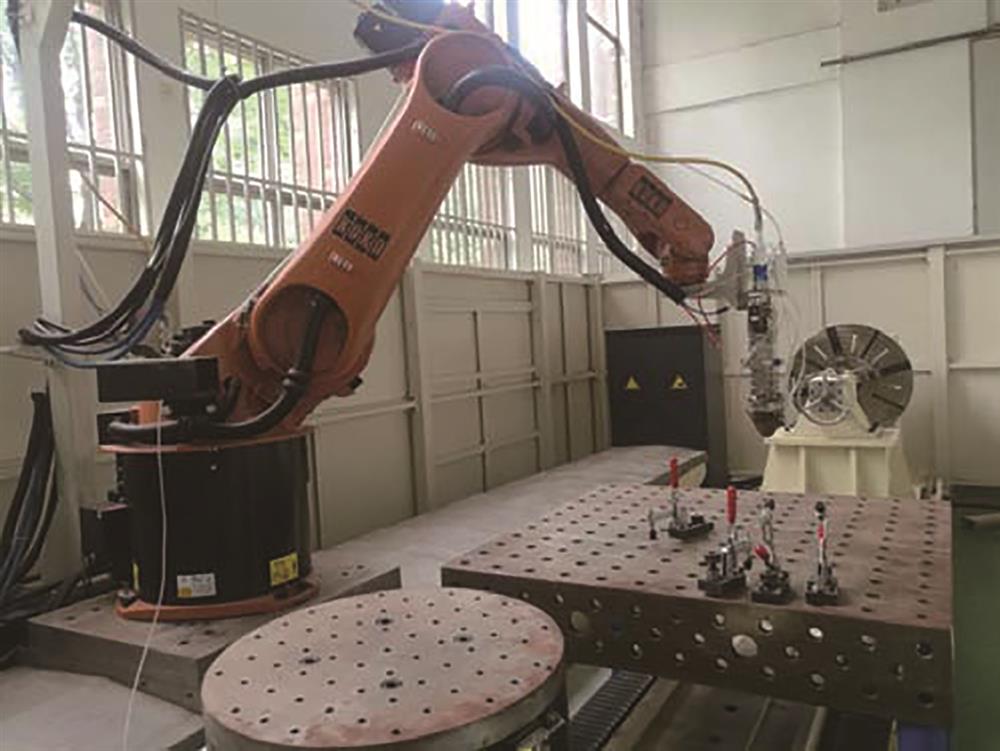
Fig. 1. Coaxial powder feeding laser forming system
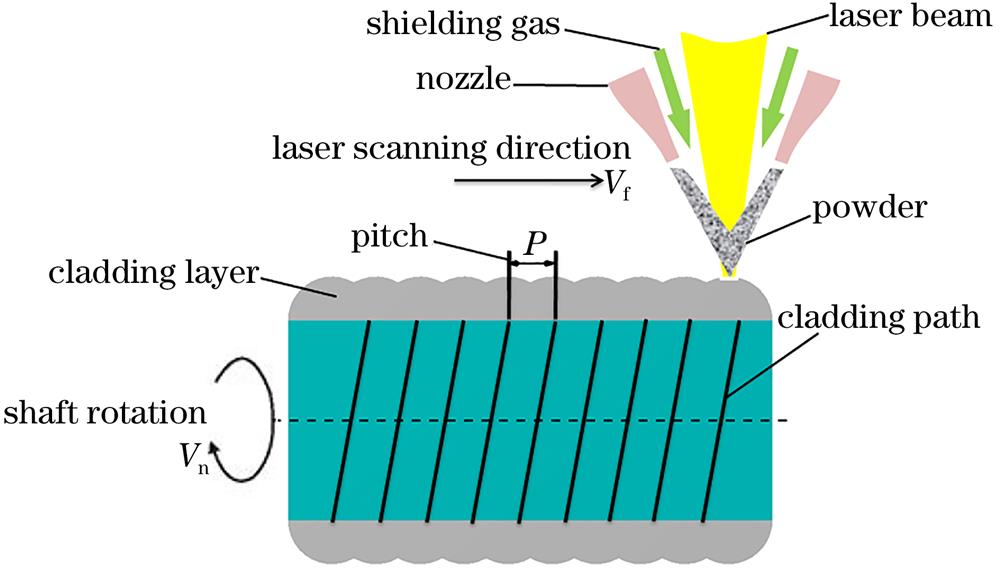
Fig. 2. Laser cladding principle of shaft parts
Fig. 3. Effects of laser power on morphologies and properties of cladding coating. (a) Morphologies of cladding coating; (b) variation of thickness, dilution ratio and micro-hardness with laser power
Fig. 4. Effects of powder feeding rate on morphologies and properties of cladding coating. (a) Morphologies of cladding coating; (b) variation of thickness,dilution ratio and micro-hardness with powder feeding rate
Fig. 5. Effects of shaft speed on morphologies and properties of cladding coating. (a) Morphologies of cladding coating; (b) variation of thickness, dilution ratio and micro-hardness with shaft speed
Fig. 6. Microstructures and micro-hardness of cladding coating. (a) Bottom region; (b) middle region; (c) top region; (d) micro-hardness distribution along depth direction
Fig. 7. Friction coefficient of cladding coating at different temperatures. (a) 35 ℃; (b) 80 ℃; (c) 125 ℃
Fig. 8. Friction coefficient of 45 steel at different temperatures. (a) 35 ℃; (b) 80 ℃; (c) 125 ℃
Fig. 9. Wear rate of laser cladding coating and 45 steel at different temperatures
Fig. 10. Wear scar morphologies of substrate and cladding coating. (a) Wear surface of substrate; (b) wear surface of cladding coating; (c) three-dimensional profile of wear scar of matrix; (d) three-dimensional profile of wear scar of cladding layer
Element | C | B | Cr | Fe | Si | O | Ni |
---|
Mass fraction /% | 1.11 | 2.56 | 20.43 | 4.15 | 5.65 | 0.03 | Bal. |
|
Table 1. Chemical composition of Ni60AA powder
Group | Serial number | Power /W | Powder feeding rate /(g·min-1) | Shaft speed /(r·min-1) |
---|
1 | 1-1 | 600 | 14.2 | 2.5 | 1-2 | 750 | 14.2 | 2.5 | 1-3 | 950 | 14.2 | 2.5 | 1-4 | 1200 | 14.2 | 2.5 | 1-5 | 1500 | 14.2 | 2.5 | 1-6 | 1800 | 14.2 | 2.5 | 1-7 | 2200 | 14.2 | 2.5 | 1-8 | 3700 | 14.2 | 2.5 | 1-9 | 3400 | 14.2 | 2.5 | 2 | 2-1 | 2200 | 6.3 | 2.5 | 2-2 | 2200 | 7.5 | 2.5 | 2-3 | 2200 | 9.7 | 2.5 | 2-4 | 2200 | 11.7 | 2.5 | 2-5 | 2200 | 14.2 | 2.5 | 2-6 | 2200 | 16.3 | 2.5 | 2-7 | 2200 | 19.5 | 2.5 | 2-8 | 2200 | 22.9 | 2.5 | 2-9 | 2200 | 25.5 | 2.5 | 3 | 3-1 | 2200 | 14.2 | 1.0 | 3-2 | 2200 | 14.2 | 1.5 | 3-3 | 2200 | 14.2 | 2.0 | 3-4 | 2200 | 14.2 | 2.5 | 3-5 | 2200 | 14.2 | 3.0 | 3-6 | 2200 | 14.2 | 3.5 | 3-7 | 2200 | 14.2 | 4.0 | 3-8 | 2200 | 14.2 | 4.5 | 3-9 | 2200 | 14.2 | 5.0 |
|
Table 2. Parameter for single-factor test
No. | Disc speed /(r·min-1) | Powder feeding rate /(g·min-1) |
---|
1 | 0.6 | 6.3 | 2 | 0.8 | 7.5 | 3 | 1.0 | 9.7 | 4 | 1.2 | 11.7 | 5 | 1.4 | 14.2 | 6 | 1.6 | 16.3 | 7 | 1.8 | 19.5 | 8 | 2.0 | 22.9 | 9 | 2.2 | 25.5 |
|
Table 3. Powder feeding rate corresponding to different powder disc speeds
Level | Factor |
---|
Power /W | Powder feeding rate /(g·min-1) | Shaft speed /(r·min-1) |
---|
Level 1 | 1400 | 11.7 | 2.3 | Level 2 | 1500 | 14.2 | 2.5 | Level 3 | 1600 | 16.3 | 2.7 |
|
Table 4. Experimental factors and levels
No. | Factor A | Factor B | Factor C |
---|
1 | 1 | 1 | 1 | 2 | 1 | 2 | 2 | 3 | 1 | 3 | 3 | 4 | 2 | 1 | 2 | 5 | 2 | 2 | 3 | 6 | 2 | 3 | 1 | 7 | 3 | 1 | 3 | 8 | 3 | 2 | 1 | 9 | 3 | 3 | 2 |
|
Table 5. Orthogonal experiment scheme
No. | Thickness /mm | Dilution ratio /% | Micro-hardness /HV |
---|
1 | 1.11 | 11.4 | 939 | 2 | 1.23 | 8.34 | 1034 | 3 | 1.32 | 4.90 | 1084 | 4 | 1.03 | 16.2 | 913 | 5 | 1.12 | 11.9 | 1019 | 6 | 1.54 | 9.46 | 983 | 7 | 1.03 | 18.1 | 965 | 8 | 1.35 | 13.6 | 954 | 9 | 1.42 | 11.2 | 1044 |
|
Table 6. Orthogonal experiment result
Index | Factor A | Factor B | Factor C |
---|
Thickness /mm | K1 | 1.22 | 1.06 | 1.33 | K2 | 1.23 | 1.23 | 1.23 | K3 | 1.27 | 1.43 | 1.16 | R | 0.05 | 0.37 | 0.17 | Dilution rate /% | K1 | 8.21 | 15.23 | 11.49 | K2 | 12.52 | 11.28 | 11.91 | K3 | 14.30 | 8.52 | 11.63 | R | 6.09 | 6.71 | 0.42 | Micro-hardness /HV | K1 | 1019 | 939 | 959 | K2 | 972 | 1002 | 997 | K3 | 988 | 1037 | 1023 | R | 47 | 98 | 64 |
|
Table 7. Range analysis
Factor level | | | | |
---|
| 0.0278 | 0.2066 | 0.0769 | 0.1037 | | 0.0280 | 0.1355 | 0.0734 | 0.0789 | | 0.0289 | 0.1186 | 0.0746 | 0.0741 | | 0.1787 | 0.1227 | 0.1478 | 0.1497 | | 0.2074 | 0.1656 | 0.1578 | 0.1769 | | 0.2411 | 0.2192 | 0.1633 | 0.2078 | | 0.1030 | 0.0108 | 0.0986 | 0.0708 | | 0.0953 | 0.0104 | 0.1025 | 0.0694 | | 0.0898 | 0.0106 | 0.1052 | 0.0685 |
|
Table 8. Matrix analysis of various factors and levels
Area | Mass fraction /% |
---|
Ni | Fe | Cr | Si | C | B |
---|
A B C D E F G | 23.56 | 69.48 | 4.03 | 1.85 | 1.08 | - | 15.30 | 47.22 | 29.68 | 1.08 | 6.71 | - | 28.13 | 56.59 | 11.03 | 0.78 | 3.48 | - | 5.05 | 4.79 | 84.56 | 0.68 | 2.59 | 2.32 | 38.99 | 7.73 | 40.40 | 3.12 | 9.77 | - | 34.94 | 3.98 | 26.02 | 4.20 | 29.88 | 0.98 | 22.17 | 3.80 | 50.59 | 2.81 | 20.63 | - |
|
Table 9. EDS scanning at different positions in Fig. 6
No. | 1 | 2 | 3 | 4 | 5 | 6 | 7 | 8 | 9 | 10 | Mean |
---|
Substrate | 1142 | 1210 | 1255 | 1130 | 1178 | 1098 | 1055 | 1168 | 1289 | 1154 | 1167 | Cladding layer | 673 | 614 | 508 | 651 | 495 | 597 | 681 | 588 | 533 | 507 | 584 |
|
Table 10. Wear scar width of substrate and cladding layer