
Jia Zhang, Liang Hong, Sheng Ren, Feifan Zhou, Rui Hu, Junle Qu, Liwei Liu. Research Progress on Label-Free Microscopic Imaging Technology[J]. Laser & Optoelectronics Progress, 2019, 56(7): 070005
- Laser & Optoelectronics Progress
- Vol. 56, Issue 7, 070005 (2019)
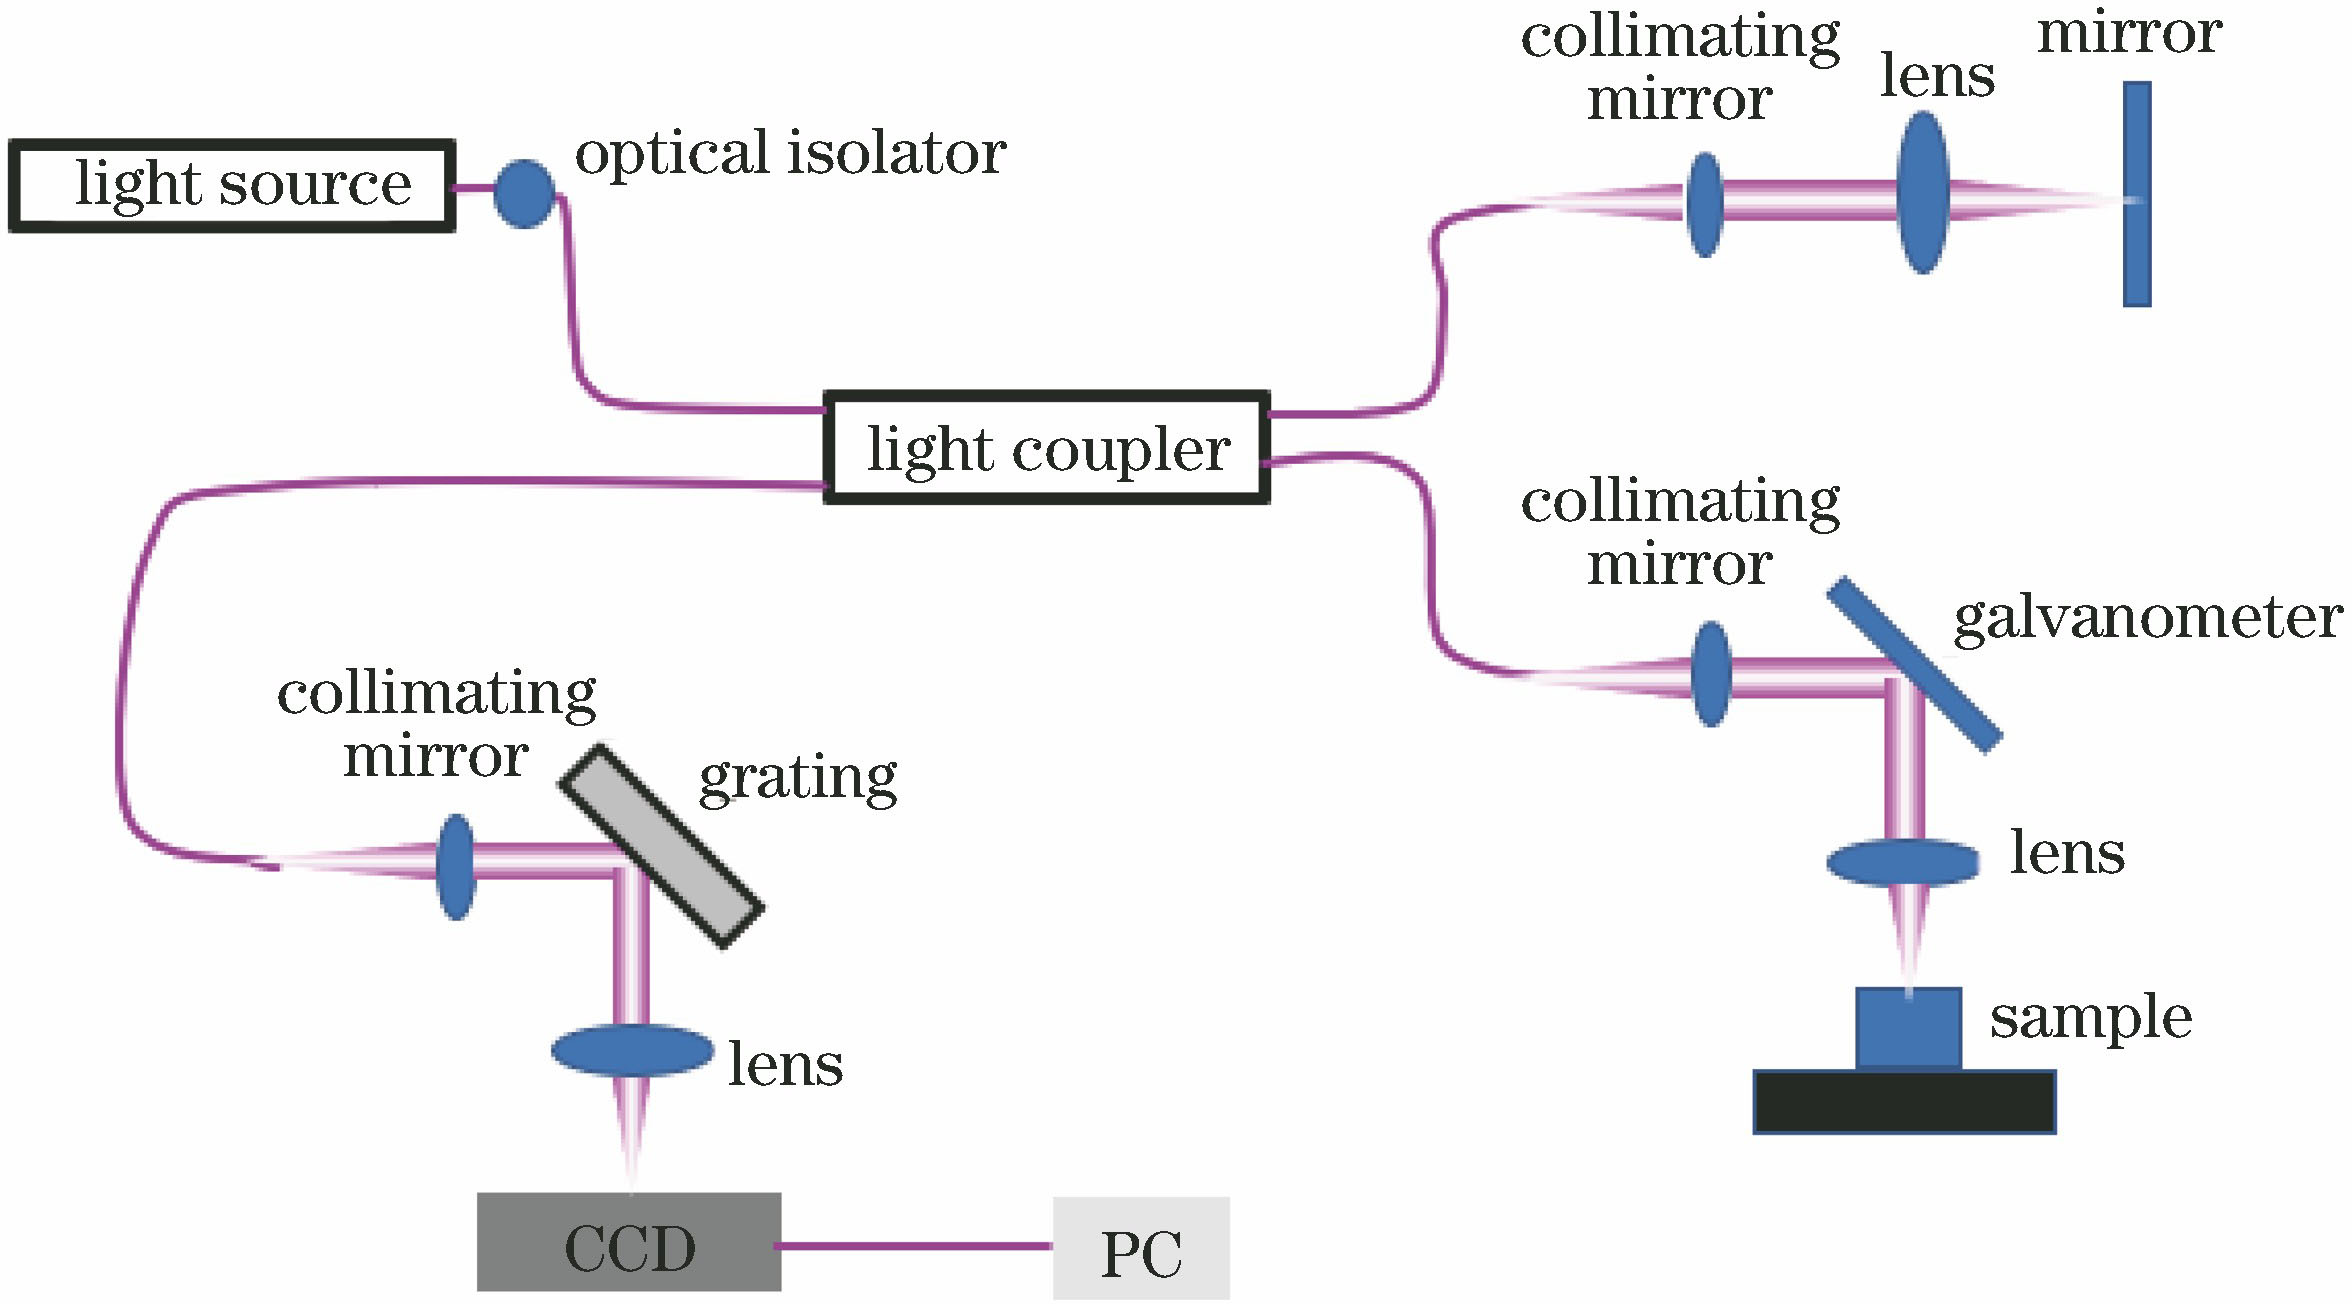
Fig. 1. Schematic of OCT system
![Angio-OCT images of human retina. (a) Large field of view (12 mm×16 mm) for Angio-OCT image of human retina; (b) optic nerve papilla image; (c) fovea image; (d) temporal region image (field of view is 2.0 mm×2.4 mm)[9]](/richHtml/lop/2019/56/7/070005/img_2.jpg)
Fig. 2. Angio-OCT images of human retina. (a) Large field of view (12 mm×16 mm) for Angio-OCT image of human retina; (b) optic nerve papilla image; (c) fovea image; (d) temporal region image (field of view is 2.0 mm×2.4 mm)[9]
Fig. 3. MIP of palm skin.(a)MIP of the epidermal-dermal junction; (b) MIP of the smaller vessels and captllary loops at the epidermal-dermal junction; (c) MIP of the bigger vesels under the horizontal plexus[21]
Fig. 4. Summary of morphological features revealed by THG microscopy[29]
Fig. 5. Adenovirus clusters images of immersed microsphere lens. (a) High magnification SEM image of adenovirus clusters; (b) low magnification SMON image of adenovirus clusters (100 μm BaTiO3 microsphere coupled with a 503 objective lens, NA=0.75); (c) higher magnification SEM image of adenovirus clusters; (d) higher magnification SMON image of adenovirus clusters (100 μm BaTiO3 microsphere coupled with an 803 objective lens, NA=0.9)[37]
Fig. 6. Doppler OCT imaging of hemodynamics inside heart tube of a live mouse embryo
Fig. 7. THG/SHG endomicroscopy results of ex-vivo human brain tissues. (a) Neuronal somata tissue; (b) gray matter neuropil tissue; (c) low-cellularity white matter area; (d) high-grade glioma[55]
Fig. 8. CARS microscope tracking lipid droplet formation experiment. (a) Progress of differentiation of mesenchymal stem cells into adipose; (b) volume change of the lipid droplet depicted by the Imaris software (Bitplane); (c1) comparison between the surface increase of the main acceptor lipid droplet and the net surface provided by the fusing lipid droplet; (c2) comparison between the volume increase of the main acceptor lipid droplet and the net volume of all fusing lipid droplets[63]
Fig. 9. Multimodal imaging of living mouse ears. (a) image of PAI; (b) image of OCT;(c) MAP image of FLM; (d) fused image of PAI, OCT, and FLM; (e) OCT/PAI tomography image corresponding to 1 in Fig. 9 (a); (f) OCT/PAI tomography image corresponding to 2 in Fig. 9(a)[66]

Set citation alerts for the article
Please enter your email address
© Copyright 2018-2021 | Chinese Laser Press. All Rights Reserved 沪ICP备15018463号-20