Author Affiliations
Institute of Laser Engineering, Faculty of Materials and Manufacturing, Beijing University of Technology, Beijing 100124, Chinashow less
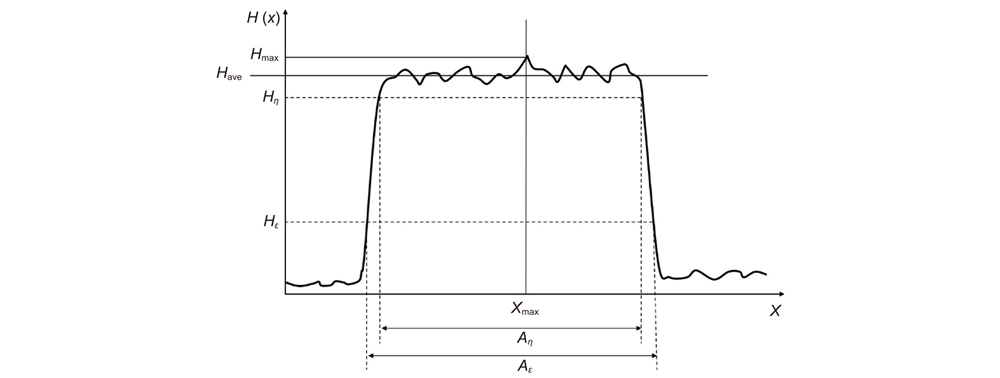
Fig. 1. Illustration for a uniform energy density distribution H(x) in one dimension
Fig. 2. Structure of aspheric shaping system
Fig. 3. Experimental device diagram
Fig. 4. Laser power stability test
Fig. 5. Light intensity distribution maps corresponding to different incident beam diameters. (a) D=1.0 mm; (b) D=1.2 mm; (c) D=1.4 mm; (d) D=1.6 mm; (e) D=1.8 mm; (f) D=2.0 mm
Fig. 6. Fitting curves of incident beam diameter with optimal shaping position, flatness factor, beam uniformity and edge steepness. (a) D-L fitting curve; (b) D-FF fitting curve; (c) D-U fitting curve; (d) D-s fitting curve
Fig. 7. Light intensity distributions corresponding to different incident divergence angles. (a) θ=3.7 mrad; (b) θ=6.5 mrad; (c) θ=9 mrad; (d) θ=11.5 mrad; (e) θ=13.5 mrad; (f) θ=18.4 mrad
Fig. 8. Fitting curve of incident divergence angle with optimal shaping position, flatness factor, beam uniformity and edge steepness. (a) θ-L fitting curve; (b) θ-FF fitting curve; (c) θ-U fitting curve; (d) θ-s fitting curve
| Radius | Thickness/mm | Glass | Asphere coefficients | | | | Infinity | | 1 | −8.090 | 20 | F_SILICA | | 2 | −17.379 | 80 | | k=−4.74
A4=−2.81*10−4A6=8.42*10−7A8=−6*10−10 | 3 | 133.384 | 8 | F_SILICA | k=10
A4=−1.94*10−5A8=−3*10−9 | 4 | Infinity | | | |
|
Table 1. Design parameters of aspheric shaping mirror
Beam diameter D/mm
| Optimal shaping position L/mm
| Flatness factor FF/%
| Beam uniformity U/%
| Edge steepness s/%
| 1.0 | 850 | 89.8803 | 20.0794 | 13.9002 | 1.1 | 730 | 86.7492 | 17.9022 | 11.9430 | 1.2 | 690 | 87.9511 | 16.6073 | 11.7702 | 1.3 | 570 | 85.2646 | 15.6862 | 11.2720 | 1.4 | 450 | 85.2263 | 15.2206 | 10.5791 | 1.5 | 390 | 86.3391 | 15.6993 | 11.6226 | 1.6 | 340 | 84.3405 | 15.4293 | 10.5575 | 1.7 | 290 | 86.5626 | 15.9967 | 11.7576 | 1.8 | 220 | 87.5674 | 17.6968 | 13.2841 | 1.9 | 210 | 85.6298 | 18.9863 | 13.8889 | 2.0 | 170 | 84.0177 | 18.0513 | 14.7741 | 2.2 | 160 | 85.6318 | 22.0324 | 19.0972 | 2.4 | 130 | 85.9729 | 24.1604 | 21.5402 |
|
Table 2. Influence of incident beam diameter on aspheric shaping
Beam divergence angle θ/mrad
| Optimal shaping position L/mm
| Flatness factor FF/%
| Beam uniformity U/%
| Edge steepness s/%
| 3.7 | 460 | 87.2936 | 17.0394 | 12.6779 | 5.7 | 430 | 85.4862 | 17.6772 | 12.8009 | 6.5 | 450 | 85.2263 | 15.2206 | 10.5791 | 9.0 | 440 | 86.3266 | 16.0942 | 11.6845 | 11.5 | 380 | 82.9033 | 15.1435 | 10.6089 | 13.5 | 370 | 84.4335 | 16.9548 | 12.6164 | 18.4 | 230 | 86.4570 | 21.6925 | 18.8504 |
|
Table 3. Influence of incident divergence angle on aspheric surface shaping
Factors | | −1 | −0.592 | 0 | 0.592 | 1 | Beam divergence angle/mrad | | 3.7 | 5.7 | 8.6 | 11.5 | 13.5 | Beam diameter/mm | | 1.0 | 1.2 | 1.5 | 1.8 | 2.0 |
|
Table 4. Experimental influencing factors and experimental design level
Number | Beam divergence angle θ/mrad
| Beam diameter D/mm
| Optimal shaping position L/mm
| 1 | 3.7 | 1.0 | 1050 | 2 | 3.7 | 2.0 | 230 | 3 | 5.7 | 1.5 | 400 | 4 | 8.6 | 1.2 | 560 | 5 | 8.6 | 1.5 | 360 | 6 | 8.6 | 1.8 | 200 | 7 | 11.5 | 1.5 | 320 | 8 | 13.5 | 1.0 | 750 | 9 | 13.5 | 2.0 | 150 |
|
Table 5. Experimental data table
Source | Sum of squares | df | Mean square | F-value | P-value | | Model | 3.14 | 2 | 1.57 | 148.06 | < 0.0001 | significant | Beam divergence angle | 0.1708 | 1 | 0.1708 | 16.10 | 0.0070 | | Beam diameter | 2.97 | 1 | 2.97 | 280.03 | < 0.0001 | | Residual | 0.0637 | 6 | 0.0106 | | | | Cor total | 3.21 | 8 | | | | | R2=0.9801
| Pre-R2=0.9395
| | | | | | Adj-R2=0.9735
| Adeq-precision=33.1476 | | | | | |
|
Table 6. Analysis of variance of the optimal shaping position
Number | Beam divergence angle/mrad | Beam diameter/mm | Optimal shaping position/mm | Error/% | Experiment value | Predicted value | 1 | 3.7 | 1.3 | 610 | 620.5357 | 1.73 | 2 | 3.7 | 1.6 | 410 | 385.1141 | 6.07 | 3 | 3.7 | 1.75 | 300 | 303.3896 | 1.13 | 4 | 5.7 | 1.1 | 770 | 789.0354 | 2.47 | 5 | 5.7 | 1.7 | 310 | 303.9078 | 1.97 | 6 | 5.7 | 2.0 | 210 | 188.6099 | 10.19 | 7 | 6.5 | 1.2 | 720 | 652.4120 | 9.39 | 8 | 6.5 | 1.5 | 430 | 404.8971 | 5.84 | 9 | 6.5 | 1.75 | 290 | 272.0801 | 6.18 | 10 | 9.0 | 1.2 | 610 | 591.9518 | 2.96 | 11 | 9.0 | 1.5 | 350 | 367.3745 | 4.96 | 12 | 9.0 | 1.85 | 220 | 210.5727 | 4.29 | 13 | 13.5 | 1.5 | 280 | 308.3790 | 10.14 |
|
Table 7. Verification experiment of predictive function