• Chinese Optics Letters
  • Vol. 20, Issue 6, 062501 (2022)
Yuxuan Li1, Xiaobin Liu1, Xuetong Li1, Lanxuan Zhang1, Baisong Chen1, Zihao Zhi1, Xueyan Li1, Guowei Zhang2、3, Peng Ye2、3, Guanzhong Huang2、3, Deyong He2、3, Wei Chen2、3, Fengli Gao1, Pengfei Guo4, Xianshu Luo4, Guoqiang Lo4, and Junfeng Song1、5、*
Author Affiliations
  • 1State Key Laboratory of Integrated Optoelectronics, College of Electronic Science and Engineering, Jilin University, Changchun 130012, China
  • 2CAS Key Laboratory of Quantum Information, University of Science and Technology of China, Hefei 230026, China
  • 3CAS Center for Excellence in Quantum Information and Quantum Physics, University of Science and Technology of China, Hefei 230026, China
  • 4Advanced Micro Foundry Pte Ltd., Singapore 117685, Singapore
  • 5Peng Cheng Laboratory, Shenzhen 518000, China
  • show less
    DOI: 10.3788/COL202220.062501 Cite this Article Set citation alerts
    Yuxuan Li, Xiaobin Liu, Xuetong Li, Lanxuan Zhang, Baisong Chen, Zihao Zhi, Xueyan Li, Guowei Zhang, Peng Ye, Guanzhong Huang, Deyong He, Wei Chen, Fengli Gao, Pengfei Guo, Xianshu Luo, Guoqiang Lo, Junfeng Song. Germanium-on-silicon avalanche photodiode for 1550 nm weak light signal detection at room temperature[J]. Chinese Optics Letters, 2022, 20(6): 062501 Copy Citation Text show less
    Structure diagram of the lateral SACM Ge-on-Si APD.
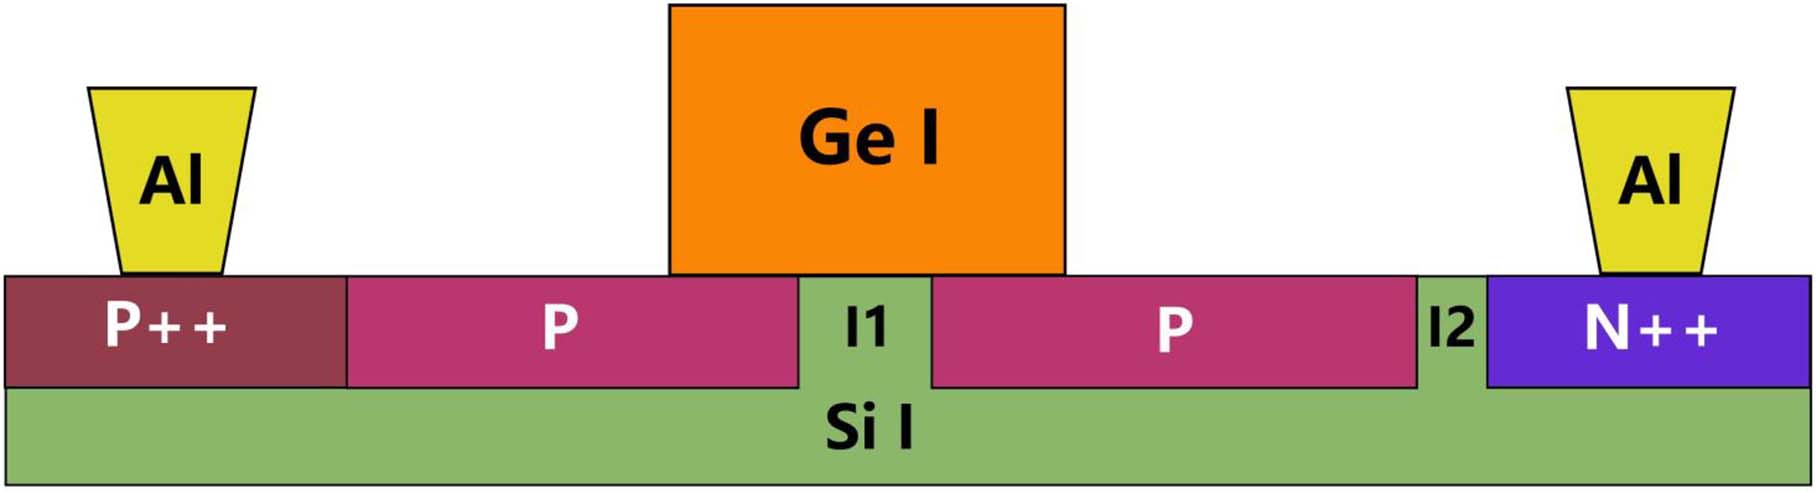
    Fig. 1. Structure diagram of the lateral SACM Ge-on-Si APD.
    (a) Distribution of valence and conduction bands in the I1 region at -2 V and -9 V (Vex = 20%Vbr). (b) The electric field distribution in the Si substrate at -2 V and -9 V.
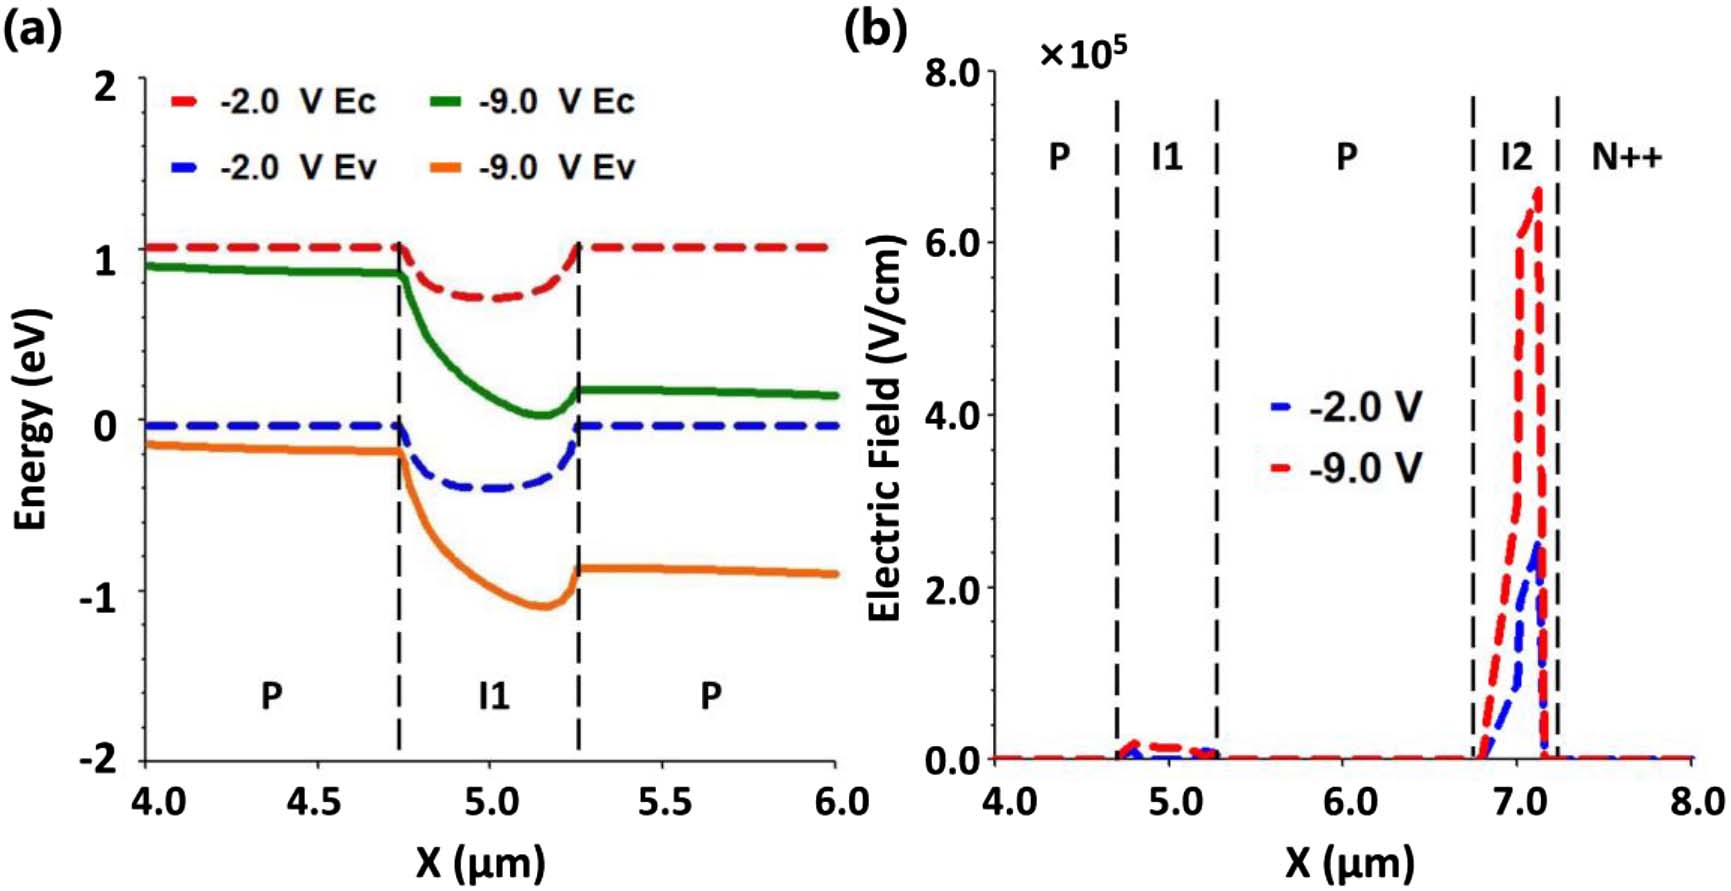
    Fig. 2. (a) Distribution of valence and conduction bands in the I1 region at -2 V and -9 V (Vex = 20%Vbr). (b) The electric field distribution in the Si substrate at -2 V and -9 V.
    (a) Photo-dark current of the SACM APD. (b) Avalanche probability simulation of the SACM APD.
    Fig. 3. (a) Photo-dark current of the SACM APD. (b) Avalanche probability simulation of the SACM APD.
    (a) Setup of the weak light signal detection experiment. The red lines are the optical paths, and the black ones represent the electrical paths. (b) Diagram of the device under test (DUT).
    Fig. 4. (a) Setup of the weak light signal detection experiment. The red lines are the optical paths, and the black ones represent the electrical paths. (b) Diagram of the device under test (DUT).
    (a) DCR of the detection system versus excess bias at 300 K. (b) DCR of the detection system versus repetition rate of gate pulse with 20% excess bias applied.
    Fig. 5. (a) DCR of the detection system versus excess bias at 300 K. (b) DCR of the detection system versus repetition rate of gate pulse with 20% excess bias applied.
    (a) Detection efficiency η of the detection system versus excess bias at 300 K. (b) NEP of the detection system versus excess bias at 300 K.
    Fig. 6. (a) Detection efficiency η of the detection system versus excess bias at 300 K. (b) NEP of the detection system versus excess bias at 300 K.
    Histograms of the DUT at 20% excess bias.
    Fig. 7. Histograms of the DUT at 20% excess bias.
    ReferenceTemperature (K)DCR (cps)Wavelength (nm)nη (%)
    [25]805.34×10513100.15.27
    [26]783×105131031
    [27]1251×10513100.0129.4
    This Work3001.1×106155017.8
    Table 1. Detection Performance of Ge-on-Si APD in Geiger Mode
    Yuxuan Li, Xiaobin Liu, Xuetong Li, Lanxuan Zhang, Baisong Chen, Zihao Zhi, Xueyan Li, Guowei Zhang, Peng Ye, Guanzhong Huang, Deyong He, Wei Chen, Fengli Gao, Pengfei Guo, Xianshu Luo, Guoqiang Lo, Junfeng Song. Germanium-on-silicon avalanche photodiode for 1550 nm weak light signal detection at room temperature[J]. Chinese Optics Letters, 2022, 20(6): 062501
    Download Citation