
Zachary N. Coker, Xiao-Xuan Liang, Allen S. Kiester, Gary D. Noojin, Joel N. Bixler, Bennett L. Ibey, Alfred Vogel, Vladislav V. Yakovlev, "Synergistic effect of picosecond optical and nanosecond electrical pulses on dielectric breakdown in aqueous solutions," Photonics Res. 9, 416 (2021)
- Photonics Research
- Vol. 9, Issue 3, 416 (2021)
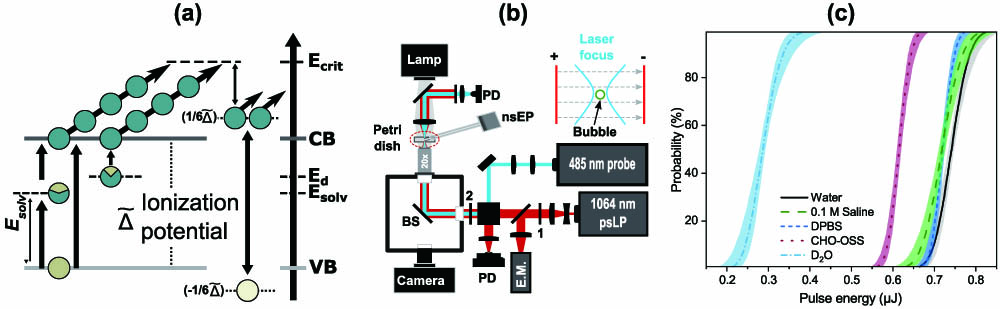
Fig. 1. Experimental design. (a) Tentative band structure of biological solution and plasma dynamics during the optoelectrical breakdown process. (b) Schematic representation of opto-electrical breakdown setup for bubble formation and detection with red indicating 1064 nm beam path and cyan indicating 485 nm probe beam path. Abbreviations indicate polarizing beam splitter cube (PBS), beam splitter (BS), pulse energy meter (E.M.), dichroic beam splitter (DBS), 750 nm short-pass filter (SPF), and photodiode (PD). Numbers 1 and 2 indicate respectively half-wave plates and 20 × 0.4 E th D 2 O
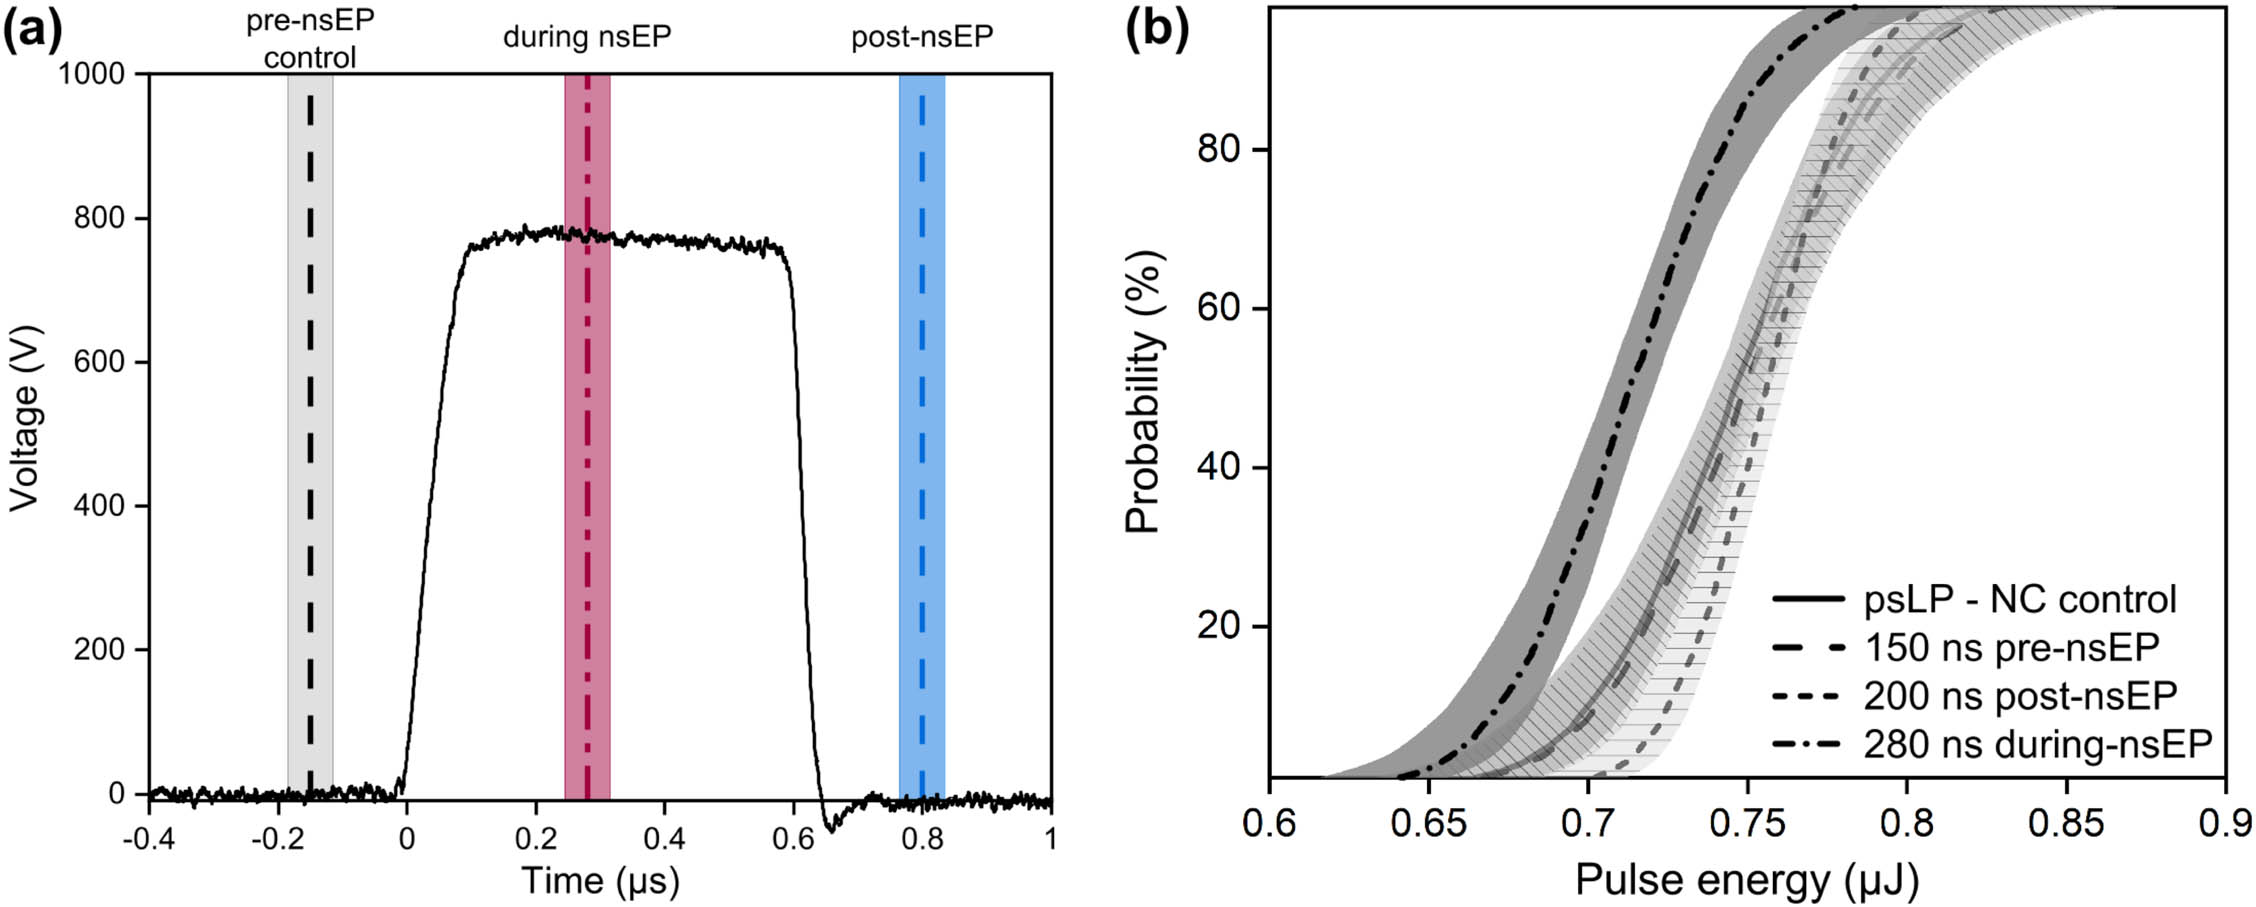
Fig. 2. Pulse timing and threshold dependence. (a) nsEP electrical impulse trace (40 kV/cm) and relative timing between of psLP pulses to nsEP. (b) Probit analysis curves from respective time points and control validation.
Fig. 3. Electro-optical breakdown modeling. (a) Plasma dynamics produced by Gaussian ps laser pulse (solid line) SFI contribution for book-keeping (dashed line); psLP profile (gray dash–dot). (b) Plasma dynamics produced by nsEP + psLP combination (solid), single 40 kV/cm nsEP (dash–dot), and single psLP (dashed line). Profiles of psLP and nsEP, their relative timing shown in gray dashed–dotted lines. (c) Visualized thought-experiment for breakdown threshold reduction: normalized irradiance as a function of seed electron density n seed I psLP = 5.75 × 10 15 W / m 2 n seed = 10 2 cm − 3 n imp
Fig. 4. Electric field and carrier density dependence. Probit analysis curves for reduction of E th


Set citation alerts for the article
Please enter your email address

© Copyright 2018-2021 | Chinese Laser Press. All Rights Reserved 沪ICP备15018463号-20