Zachary N. Coker1,2, Xiao-Xuan Liang3, Allen S. Kiester4, Gary D. Noojin2..., Joel N. Bixler4, Bennett L. Ibey4, Alfred Vogel3 and Vladislav V. Yakovlev1,5,*|Show fewer author(s)
Zachary N. Coker, Xiao-Xuan Liang, Allen S. Kiester, Gary D. Noojin, Joel N. Bixler, Bennett L. Ibey, Alfred Vogel, Vladislav V. Yakovlev, "Synergistic effect of picosecond optical and nanosecond electrical pulses on dielectric breakdown in aqueous solutions," Photonics Res. 9, 416 (2021)
Copy Citation Text
The combined effect of short (picosecond) optical and (nanosecond) electrical pulses on dielectric breakdown is investigated both theoretically and experimentally. It was demonstrated that nanosecond electrical pulses (nsEPs), being applied simultaneously with picosecond optical pulses, reduce the threshold for optical breakdown. Experimental results are discussed with respect to an extended model for opto-electrical-induced breakdown. The newly unveiled effect is expected to play a significant role in spatially confined electroporation and further advances in laser-ablation-based processes while also allowing for measurements of ambipolar diffusion constants.
1. INTRODUCTION
Dielectric breakdown phenomena, and its driving physical processes, have been the subject of extensive experimental studies and theoretical models [1–6]. Such studies have revealed the complex physical processes that drive breakdown, i.e., ionization, and how those processes depend on a range of material properties and electric field application [7–12].
The effect of electric fields on ionization properties, including direct interactions with solvated electrons, bandgap modifications, thermal ionization, and electrical ionization of shallow donors, has been the focus of many investigations [13–15]. However, potential synergy in breakdown mechanisms under varying experimental conditions remains relatively unexplored [16–19]. One paper of interest by Gorshkov et al. reported a successful reduction in breakdown thresholds using crossed UV and IR lasers in alkali halide crystals [20]. While this paper demonstrated that a combination of electromagnetic fields can influence breakdown, minimal attention has been given to low-frequency and DC electric field effects on optical breakdown thresholds, particularly in biologically relevant media. Electric fields have been utilized to increase laser-induced emission spectra after optically induced breakdown [21]; however, the presence of externally applied electric fields before or during optical breakdown initiation has often been neglected. Limited efforts focused on interactions of DC electric fields on optically induced breakdown, described in two distinct reports [22,23], arrived at contradictory conclusions. Furthermore, a more recent report also focused on the influence of DC electric field effects on laser-induced breakdown in gases by Takahashi et al. [24] provides further support for the results reported by Mullen et al. in that an increase in optical pulse energies is required to achieve breakdown in gases under the influence of DC electric fields, while Mullen and Takahashi present arguments akin to those of Tulip and Seguin in 1976 [25], in that charged particles and free electrons are removed from the focal volume by the electric field. Each of these investigations was limited to gaseous media, which have different diffusive properties and much larger intermolecular distances than condensed states [26]. A detailed understanding of the opto-electrical breakdown processes, the underlying physics, and how to tightly control them is critical to further develop many new and evolving technologies, particularly in the fields of spectroscopy, micro-machining, and many emerging medical applications.
Past experiments and models based on density functional theory have demonstrated a direct field-dependence for molecular ionization potentials and excitation energies in dielectrics under strong electric field conditions [15,27]. While the electric fields discussed in these reports () are well above the dielectric strength of any biologically relevant aqueous solutions () [13], the underlying fundamental physics does not change; electrons and ions are still driven by the presence of an external field. Therefore, we hypothesized that we could decrease the effective energy required for a picosecond laser pulse (psLP) to achieve optical breakdown visualized via bubble formation in aqueous solutions through the application of an external 500 ns electrical impulse (nsEP) at the focal volume of the laser (well below the normal dielectric breakdown threshold). In this report, we establish an experimental setup to examine the influence of external electric field impulses on optical breakdown thresholds in biological-relevant media. We then provide an explanation of and support for our results through a theoretical opto-electrical breakdown model. We therefore introduce a synergistic effect that has yet to be thoroughly investigated or employed using two technologies that are already prevalent in biomedical sciences: nanosecond pulsed electric fields and picosecond laser-induced optical breakdown. This synergistic effect has wide range for potential use in studies of fluid dynamics and for biomedical applications.
Sign up for Photonics Research TOC. Get the latest issue of Photonics Research delivered right to you!Sign up now
2. METHODS AND DESIGN
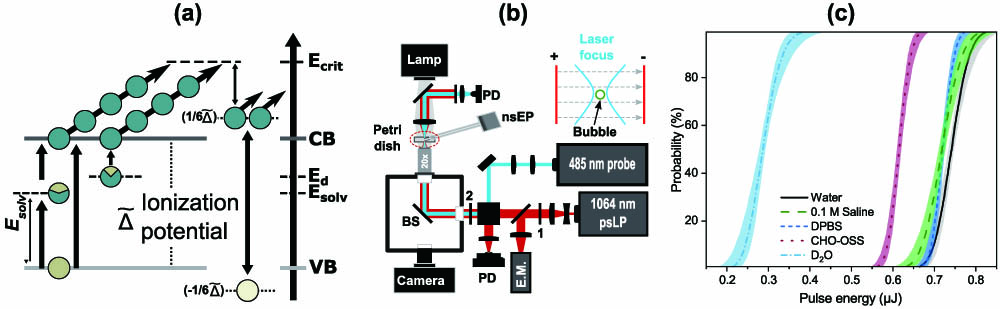
The band structure of water and other biological solutions is of critical importance for understanding breakdown behaviors and is the basis for the theoretical modeling provided in this report. While for many dielectrics the band structure is fully characterized by the energy gap between valence band (VB) and conduction band (CB) electrons, water exhibits an intermediate energy level, , between these bands. Recent studies have revealed the bandgap of water to be about 9.5 eV with the intermediate energy level located at 6.6 eV above the VB [11,12]. The existence of this intermediate level is due to the network of weak hydrogen bonds between water molecules, in which thermal fluctuations can produce favorable constellations for electron abstraction from excited molecules. These intermediate levels are known as “preexisting traps” and have a number density of about . Furthermore, for ultrashort laser pulses, the effective ionization potential, , the total energy required to excite electrons from the VB to the CB needs to be considered, which takes into account both the bandgap and oscillation energy of electrons in the laser electric field [2,12,28,29].
Figure 1.Experimental design. (a) Tentative band structure of biological solution and plasma dynamics during the optoelectrical breakdown process. (b) Schematic representation of opto-electrical breakdown setup for bubble formation and detection with red indicating 1064 nm beam path and cyan indicating 485 nm probe beam path. Abbreviations indicate polarizing beam splitter cube (PBS), beam splitter (BS), pulse energy meter (E.M.), dichroic beam splitter (DBS), 750 nm short-pass filter (SPF), and photodiode (PD). Numbers 1 and 2 indicate respectively half-wave plates and NA microscope objective. (c) Probit analysis curves and 95% confidence intervals of breakdown threshold () measurements across various biologically relevant sample solutions (MiliQ Milipore 18 MW · cm water, 0.1 M saline solution, DPBS, physiological imaging buffer, and ).
A single rate equation (SRE) model previously developed by Liang et al. [29] was employed to simulate breakdown conditions. This SRE model uses an asymptotic regime approach like that derived by Rethfeld [16] but was derived from a simplified energy splitting scheme, compared with Christensen and Balling [18], which accounts for conservation of energy among post-collision particles. The avalanche ionization rate in the asymptotic regime has a closed form , where is the cross section of inverse Bremsstrahlung absorption and is the transient irradiance. The maximum AI rate induced by the Gaussian psLP at its peak irradiance () is , whereas the AI rate induced by the nsEP approximated by a 10 μm laser pulse with equivalent electric field strength is .
This simplified scheme is justified since the asymptotic conditions are fulfilled [29]. More specifically, as determined by Liang et al. [29] for pulse durations longer than 250 fs (asymptotic regime), the complex multirate equation that is generally used to describe the inverse Bremsstrahlung absorption and impact ionization can be simplified into a single rate equation. Since the pulse duration in this study is much longer than 250 fs, we chose the asymptotic single rate equation for our optical breakdown model. Additionally, we have extended the model to include an AI contribution term to account for the nanosecond electrical impulse in Eq. (1). Electron recombination processes and diffusion out of the focal volume are critically important for picosecond pulse duration and mandatory for longer nanosecond duration; therefore, two additional loss terms are added to account for contributions of recombination and diffusion rates in the target media:
The first term on the right-hand side of the equation represents the contributions from laser strong field interactions (). This term considers the laser-driven excitation of VB electrons to the CB across the entire bandgap, , via intermediate level through both multiphoton and tunneling ionization. These ionization rates depend on wavelength, electric field intensity, and bandgap, as described by the well-known Keldysh formula [2]. Terms and denote the avalanche ionization rate for the SRE asymptotic regime for a single laser pulse and the avalanche ionization rate for the electric impulse, respectively. For a more detailed formulation and derivation of the and terms, the reader is referred to Liang et al. [29]. The terms denote the number density of charge carriers, with specifying subscripts , indicating total, valence, and bound, with , and the ratio denoting the potential for a depleted valence band in the ionization process. Since the donor electron level is unknown, tunneling of donor electrons by external electric field into the CB is simplified as a background electron density, , which approaches the number density of donor electrons, . Finally, and denote losses from electron recombination and diffusion, respectively. Diffusion in polar liquids is different from diffusion in gases [32]. In polar liquids, the external field from the positively charged ions and from the surrounding polar environment slows the diffusion of electrons and leads to a reduced ambipolar diffusion coefficient, [26]. In this paper, we use corresponding to diffusion time , [12], and for number density of bound electrons that can be ionized in pure water. The model can, in general, simulate optical breakdown induced by any two wavelength laser pulse combinations with adjustable interpulse intervals. Additionally, we can effectively “turn off” the contributions from either the psLP or nsEP by setting their individual components to zero. With this in mind, we modeled the contribution from DC electric field impulses via the IBA rate of a 10 μm wavelength laser pulse, as the DC breakdown threshold is closely reflected by that of long wavelength laser pulses such as those from a laser pulse [13].
We note that, within our model, the bandgap and energy-level modifications provided by the DC electric field are neglected. This is because, even in the case of our greatest field intensity of 40 kV/cm, the reduction of the bandgap is quite small. The bandgap reduction is described by Eq. (2), as provided by Keldysh while discussing the Keldysh-Franz effect [33]: where is the elementary charge, is the Dirac constant, and is the effective mass of an electron and hole. Taking and as the mass of an electron, we obtained . This value is marginally small when compared with the bandgap of water and is therefore negligible. Further evidence is provided by findings of Zhu et al., where simulation results showed a reduction in the bandgap of amorphous of only 0.2 eV under an above-threshold static electric field of .
B. Opto-Electrical Breakdown Thresholds
We utilized our opto-electrical breakdown model to validate and explain experimental observations against our hypothesis. A schematic of the experimental setup is presented in Fig. 1(b). We used a 1064 nm, 14 ps laser (APL-X 1064-532; Attodyne Inc., Toranto, Ontario) to initiate breakdown, which was chosen to exclude direct absorption of light by biological molecules, increasing the overall dependence on AI in the breakdown and bubble formation process [12]. The laser spot at the sample volume was estimated near the diffraction limit, with an approximate spot radius of 1.33 μm and Rayleigh length of 7.8 μm, providing a fairly small interaction volume of roughly μ. A 485 nm probe laser with 0.4 mW average power was coaligned and focused to a photodiode after the sample for breakdown detection. Breakdown events distort the focal volume of the laser and thus are detected as fluctuations in signal intensity measured at the photodiode. A pair of tungsten electrodes was centered about the laser focus, 200 μm above the cover glass of a petri dish. The nsEP system has been described previously [34] and provided a trapezoidal profile electric field with approximately 100 ns rise time, 500 ns working time, and 30 ns fall time for the delivered impulse. All electrical and optical pulse timing was controlled by a pulse delay generator (DG535; Stanford Research Systems, Inc.). The DC field intensities were well below the dielectric breakdown threshold for the target media, no arcing or direct electric breakdown phenomena were observed, and all breakdown events were limited to that of the optical breakdown regime. The tungsten electrodes were, however, located within the field of view of the microscope and thus were easily observed during and inspected after each series of experiments via digital camera. No visible damage was detected on the electrode surfaces throughout this study. Furthermore, the cell culture dishes used to hold the sample volumes were designed for optical imaging of biological targets for extended duration using blue wavelengths and were replaced often. The measured intensity for the 485 nm probe beam did not decrease through the entirety of the experiments, indicating that no color centers or other defects were observed that would distort or decrease light transmission and breakdown detection or reduce pulse energy delivery to the sample.
Breakdown threshold energies () were determined by recording bubble formation for each laser pulse from subthreshold to super-threshold. Here, we define as the 50% breakdown probability with energy-probability curves generated by sigmoidal probit regression analysis of 200–250 pulses [35]. We measured once per day across three days to verify the stability of our measurements and to account for day-to-day variability in laser performance. We found the three-day average for in pure water to be = μ. Since the ultimate goal is to translate our research into biologically relevant applications, we tested optical-breakdown threshold energies in a variety of solutions other than pure water: Dulbecco’s phosphate-buffered saline (DPBS–Sigma-Aldrich, St. Louis, MO); a pH 7.4–300 mOsm/kg live cell physiological imaging solution (referenced as CHO-OSS); 99.9% pure deuterated water (O); and finally 0.1 and 0.5 M (1 M = 1 mol/L) NaCl saline solutions for testing of donor electron concentration-dependence. DPBS is a standard buffered salt solution used in maintaining cell culture and preparing cell culture experiments. DPBS is commercially available through most life sciences retailers. The CHO-OSS imaging buffer solution contained 135 mM NaCl, 5 mM KCl, 10 mM HEPES, 10 mM glucose, 2 mM , and 2 mM with a pH of 7.4 and osmolality of 290–310 Osm/kg (all buffer components from Sigma-Aldrich, St. Louis, MO). Each of these samples was selected as biologically relevant while also provided for controlled variations in chemical composition and concentrations of complex molecules present in biology. Probit curves for determining for each sample are provided in Fig. 1(c). All experiments were conducted in an open air environment in our laboratory. The temperature and humidity of the laboratory were maintained by the laboratory air-conditioning system in accordance with standard government laboratory guidelines (70–72°F and approx. 50% humidity). Dust level was not checked during these experiments; however, all sample volumes were contained in glass bottom petri dishes typical of cell culture experiments with glass coverslip approximately 170 μm thick (Cat:P35G-1.5-14-C 35 mm dish, No. 1.5 coverslip, 14 mm glass diameter, uncoated; Mattek Corporation, Ashland, MA). These petri dishes are manufactured and stored in sterile packaging. Likewise, all sample volumes were kept sterile prior to experiments. Additional care was taken to prevent introduction of dust and other environmental contaminants to the sample space, including replacing all sample volumes every 25 pulses to reduce the impact of impurity buildup or potential ionic discharge from the electrodes. Samples were placed above the microscope objective (HCX PL Fluotar; ; Leica Microsystems) with an inverted microscope arrangement; initial trial experiments indicated that focusing too close to the surface of the glass cover slip would cause damage to the cover slip surface, leaving marks that would likely have an impact on subsequent results. Therefore, all experiments were carried out at a focal depth of 200 μm above the surface of the cover slip, as measured by the probe beam focal spot reflection imaged to our camera, thus avoiding optically induced damage and any undesired focus-related effects. The sample containers were replaced after each sample trial such that no dish was reused and to minimize potential contamination between samples.
3. RESULTS
A. Opto-Electrical Breakdown: and Controls
Figure 2.Pulse timing and threshold dependence. (a) nsEP electrical impulse trace (40 kV/cm) and relative timing between of psLP pulses to nsEP. (b) Probit analysis curves from respective time points and control validation.
To compare our experimental observations with our opto-electrical breakdown model, we initially selected background impurity density of double-distilled water [36] and calculated the theoretical condition to achieve breakdown to be a critical electron density of .
Figure 3.Electro-optical breakdown modeling. (a) Plasma dynamics produced by Gaussian ps laser pulse (solid line) SFI contribution for book-keeping (dashed line); psLP profile (gray dash–dot). (b) Plasma dynamics produced by nsEP + psLP combination (solid), single 40 kV/cm nsEP (dash–dot), and single psLP (dashed line). Profiles of psLP and nsEP, their relative timing shown in gray dashed–dotted lines. (c) Visualized thought-experiment for breakdown threshold reduction: normalized irradiance as a function of seed electron density in biological-relevant solutions. A simulated representation of a single psLP threshold based on different initial seed electron densities as provided by various nsEP intensities. Reference , for , close to in double distilled water.
The relationship for can also be rearranged to provide an estimate for the temperature rise induced by an nsEP pulse. Immediately following the psLP, CB electron density drops quickly due to recombination and then gradually levels out at due to a balance between AI induced by nsEP and losses from recombination and diffusion. According to the relationship, thermalization of one set of these electrons leads to temperature rise of . Consider that the duration of the nsEP pulse continues for roughly 300 ns after the psLP, a time much longer than the characteristic recombination lifetime that relates to by , or for with the assumed [12]. Therefore, about 13 sets of electrons are thermalized, which provides a total temperature rise on the order of .
C. Breakdown Threshold Dependencies
Previous studies have suggested that laser polarization (circular versus linear) could have an impact on breakdown thresholds [37]. We investigated the impact of our incident laser’s linear polarization angle with respect to nsEP direction (at 40 kV/cm). We observed no polarization dependence beyond the range of expected statistical errors. These results further suggest that psLP dominates initiation of the breakdown process and nsEP produces little impact beyond providing additional seed electrons.
Finally, we examined the effects of nsEP intensity and solution donor electron densities on the observed reduction phenomenon. To do this, we first measured and compared optical breakdown thresholds in DPBS under three electric field conditions with power supply output voltages of 1, 1.5, and 2 kV, corresponding to nsEP intensities of 18, 31, and 40 kV/cm, respectively, chosen as approximations to 50%, 75%, and 100% of the maximum field intensities attainable across the samples. A reliable maximum was desirable for testing our initial hypothesis, with the two lower-field intensities of 19 and 31 kV/cm chosen for evaluating any field-intensity dependencies of the synergistic effect.
To explore the impact of donor electron density, we prepared a NaCl saline solution with 0.1 and 0.5 M concentration in pure water and measured the breakdown thresholds with and without a 9 kV/cm electric field. The varying concentration of NaCl solution is akin to various densities of complex molecules in biological solutions capable of providing donor electrons for promotion to the CB. Donor density is important at longer wavelengths, as a greater carrier density in a medium provides a larger number of potential seed electrons for breakdown initiation through thermally induced collisions or through optical absorption of photons [7,38,39].
Figure 4.Electric field and carrier density dependence. Probit analysis curves for reduction of on (a) voltage dependence in DPBS biological solution and (b) donor carrier density in 0.1 M and 0.5 M saline solution with 9 kV/cm nsEP.
The results presented here demonstrate that the breakdown process observed with combined psLP and nsEP is initiated solely by the laser pulse. However, if an externally applied electric impulse is strong enough, it can provide a “primer” type effect for the target media, promoting donor electrons at energy into the CB to support the ionization process, thereby reducing . Figure 3(c) provides a visual explanation for the observed behavior as it relates to biologically relevant solutions. Both the donor level and number density of donors for biological-relevant solutions are unknown; therefore, we are unable to directly simulate threshold reduction as a function of DC field intensity but alternatively turn to an assumed increasing seed electron density with increasing DC field. Taking this into account, we consider that the extra seed electrons come in the form of donor electrons from energetic molecules in the solutions; this scenario is similar to -type doping in semiconductors [30]. Donor electrons can be driven by an external electric field into the CB through tunnel ionization, as proposed by Vanraes and Bogaerts [31]. AI induced by the electric impulse is weak, with associated temperature rise on the order of [40], as determined by indicating that the reduction phenomenon observed is specifically driven by nsEP providing additional seed electrons for the CB and not by nsEP driving AI following the optical pulse.
For example, Fig. 3(b) shows that, when breakdown is initiated in water 200 ns after the falling edge of a 40 kV/cm nsEP, the carrier density has again dropped below the minimum threshold, as determined by the first density by which irradiance threshold is shown to decrease at in Fig. 3(c). We determine this threshold for through the depiction in Fig. 3(c), where the irradiance threshold first begins to decrease. This agrees with experimental observations shown in Fig. 2(b). If we contemplate the thought-experiment explanation provided in Fig. 3(c) and consider the dynamics of following the end of the electrical impulse shown in Fig. 2(b), it follows that, as drops to its original value, the threshold is normalized as well. The promoted CB electrons, without the external electric field, will go toward solvation as they lose kinetic energy through collisions and then get trapped at the intermediate energy level above the valence band; the lifetime of these processes can be as long as 300 ns [11,41]. Breakdown simulation results demonstrate that the diffusion rates are critical for psLPs applied immediately following nsEP and determine whether there are enough seed electrons present to reduce the optical breakdown threshold. The influence of diffusion rate for CB electron density decay, post-nsEP, follows an exponential decay of the form . As the characteristic diffusion time () is much smaller than the characteristic recombination lifetime, diffusion is the dominant decay mechanisms. Furthermore, the 40 kV/cm maximum field utilized in our experiment was too weak to provide sufficient carriers for AI to entirely compensate for losses of CB electrons due to recombination and diffusion; if a stronger field was applied, we could then measure as a function of delay between the end of nsEP and the applied laser pulse. We can see by the plot in Fig. 3(c) that an external electric field providing can reduce by ; further, as mentioned previously, cannot have such an effect. Using the initial electron densities of the media and the respective measured at various times following the falling edge of nsEP along with the results from our model, we can then extrapolate the ambipolar diffusion constant, , of a target medium. A specific case that warrants additional study is that of heavy water (), as shown in Fig. 1(c), where a notably lower breakdown threshold compared with that of distilled water was reported. Several investigations have shown similarities as well as small but not insignificant differences, between the dielectric properties of water and heavy water [42–44]. A more in-depth investigation following the methodology presented in a recent report by Perry et al. may yield interesting results [45]. Likewise, the correlation between the DC field strength and the seed electron density will be pursued in future studies.
We note that this report demonstrates optical pulse synergy with a relatively long 600 ns electrical impulse and that shorter picosecond-pulse delivery systems are commercially available capable of providing much shorter duration pulses, down to 200 ps, with sharp rise and fall times that would allow for substantially higher electrical fields to be applied. Employing such systems would further expand the capabilities and application of the discovered synergistic effect. As it stands, the synergistic effect reported herein can be utilized to enhance a wide range of laser-based applications in medicine. A report by Yanik et al. demonstrated the use of 200 fs NIR laser pulses as a low-energy option for performing neuron axotomy in C. elegans [46]. Our results indicate that we can achieve even further reduction of optical pulse energy requirements for micro- and nanoscale surgeries and as well a potential method for reducing collateral damage to nearby cells and tissue. Furthermore, ablative fractional laser (AFL)-assisted drug delivery is a powerful tool for topical drug delivery systems that use a range of specific laser parameters suited to specific drugs, treatments, damage thresholds, and patient conditions [47]. Reducing the energy threshold for tissue ablation would allow for a wider range of parameter selections, particularly in cases where residual damage is a concern for treatment. Reducing laser pulse energy requirements or even removing the need for material-specific laser parameters would help to advance these techniques and their applications. We plan to expand this investigation to include biological systems and the effects of opto-electroporation of cells [48–50]. Application-based studies are currently under way utilizing the synergistic behavior detailed in this report for targeted cell response, membrane permeabilization, dye uptake, and translations to targeted drug delivery and DNA transfection.
5. CONCLUSION
In summary, a novel approach to control optical breakdown with external electrical pulses was proposed and demonstrated both theoretically and experimentally. The developed theory and accompanying experimental data provide a better understanding of the mechanisms underlying combined electric field and pulsed laser interactions at short time-scales. Our results indicate that the breakdown process under intense picosecond laser irradiation with a concurrent DC electric field is initiated solely by the laser pulse, with the DC electric field acting as a primer by providing additional seed electrons for breakdown initiation. As this method can, under carefully considered circumstances, provide an environment with a DC electric field sufficiently strong as to compensate for diffusion and recombination rates in a target medium, it is expected that we can gleam further insight into direct ambipolar diffusion measurements in specific target media, based on time-dependent measurements of following the end of a DC electric field pulse in the future.
[20] B. Gorshkov, A. Epifanov, A. A. Manenkov, A. Panov. Studies of laser-produced damage to transparent optical material in the UV region and in crossed UV-IR beams. Proceedings of the 13th Annual Symposium on Optical Materials for High Power Lasers, 76-86(1981).
Zachary N. Coker, Xiao-Xuan Liang, Allen S. Kiester, Gary D. Noojin, Joel N. Bixler, Bennett L. Ibey, Alfred Vogel, Vladislav V. Yakovlev, "Synergistic effect of picosecond optical and nanosecond electrical pulses on dielectric breakdown in aqueous solutions," Photonics Res. 9, 416 (2021)