
Yang Li, Haolin Chen, Yanxian Guo, Kangkang Wang, Yue Zhang, Peilin Lan, Jinhao Guo, Wen Zhang, Huiqing Zhong, Zhouyi Guo, Zhengfei Zhuang, Zhiming Liu, "Lamellar hafnium ditelluride as an ultrasensitive surface-enhanced Raman scattering platform for label-free detection of uric acid," Photonics Res. 9, 1039 (2021)
- Photonics Research
- Vol. 9, Issue 6, 1039 (2021)
Abstract
1. INTRODUCTION
Surface-enhanced Raman scattering (SERS) can perform label-free detection of analyte at trace or even single molecule levels, with high sensitivity and selectivity [1]. As a nondestructive vibration testing model, SERS can provide the molecular fingerprint that has been widely used in a variety of scientific fields such as environmental monitoring, food safety testing, drug inspection, and disease diagnosis [2–6]. Noble metal SERS substrates such as gold and silver nanostructures with rough surfaces have been extensively studied by means of surface plasmon resonance excited local electromagnetic field amplification [7–12]. However, the noble metal-based SERS substrates lack repeatability and controllability due to the elaborate and complex synthesis processes. With the development of nanotechnology, SERS research has recently shifted from noble metals mainly based on the electromagnetic mechanism (EM) to novel two-dimensional (2D) nanomaterials based on the chemical mechanism (CM) due to the cheap sources and simple preparation methods [13–16]. However, since CM is a short-range process that relies on the charge transfer (CT) during the resonance electron transition at the interface between the substrate and the adsorption molecule, its enhancement effect in the entire SERS is still limited to some extent [17,18]. In addition, the limits of detection (LODs) and the enhancement factors (EFs) are still much lower than that of metal nanostructures. Therefore, exploring promising 2D materials suitable for SERS analysis becomes more attractive.
Uric acid (UA), the final product of purine metabolism, is one of the most important biomarkers in body fluid. The equilibrium concentration of UA in urine is determined to be 0.952 to 5.948 mM (1 M = 1 mol/L) per 24 h and normouricemia is 0.208 to 0.416 mM (male) or 0.149 to 0.357 mM (female) [21–23]. Abnormal UA content is closely related to many diseases such as gout, kidney stones, hypertension, and cardiovascular disease [24–26]. Various methods such as high-performance liquid chromatography, isotope dilution mass spectrometry, colorimetric chemosensors, capillary electrophoresis, and electrochemical biosensors have been applied to detect UA. These techniques, however, are often hindered by complicated sample pretreatment, expensive instruments, and sophisticated instrumentation and equipment, and often lack sensitivity [27–30]. The SERS technique can provide a fast, ultrasensitive, and conventional diagnostic test method for real-time detection of UA. The SERS technique that uses various metal-based SERS substrates such as Au nanofibers,
In this work, a 2D SERS platform based on hafnium ditelluride (
Sign up for Photonics Research TOC. Get the latest issue of Photonics Research delivered right to you!Sign up now
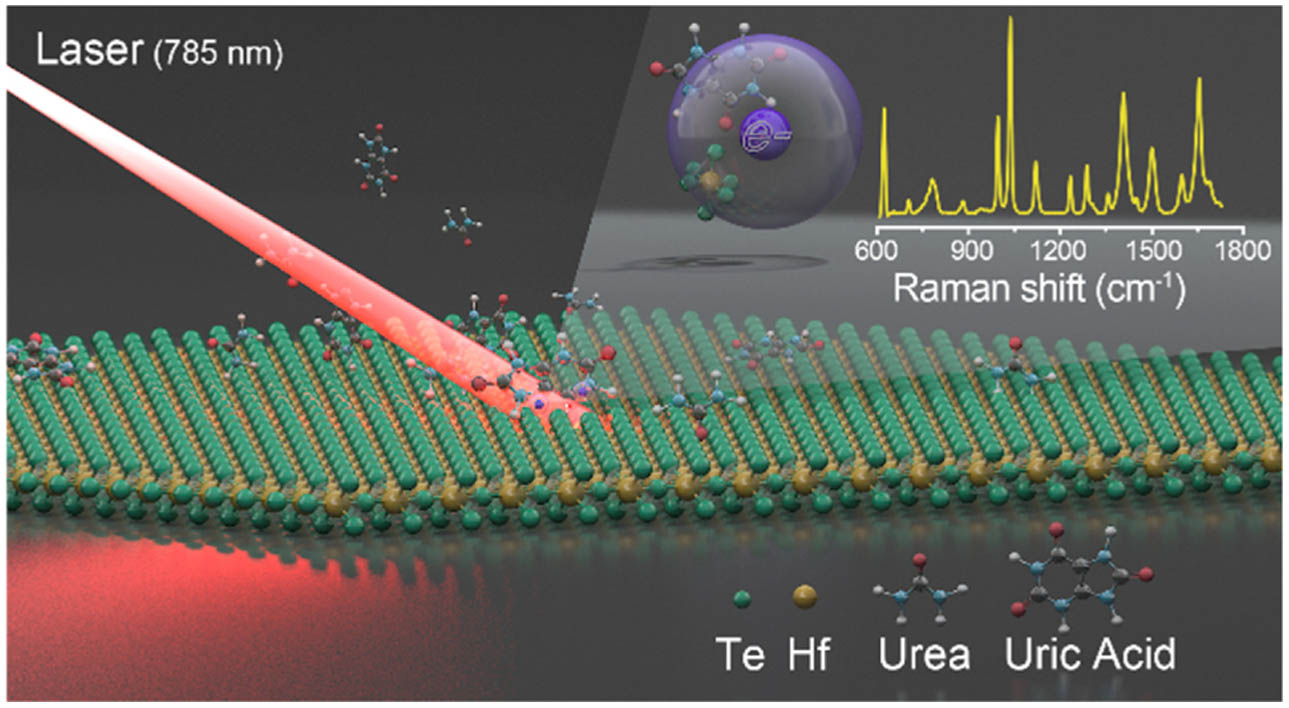
Figure 1.Schematic illustration of the SERS detection of uric acid based on
2. EXPERIMENT
A. Materials
Hafnium ditelluride was purchased from SixCarbon Technology Co., Ltd. (Shenzhen, China). Uric acid, urea, rhodamine 6G (Rh6G), crystal violet (CV), malachite green (MG), and methylene blue (MB) were purchased from Sigma-Aldrich (now MilliporeSigma, St. Louis, MO, USA). All reagents were of analytical grade and used directly without further purification. Deionized water was used throughout the study (Milli-Q System, MilliporeSigma).
B. Synthesis of
A liquid exfoliation method including probe sonication and bath sonication was combined with hydrothermal reaction to prepare
C. Characterization
The surface morphology of
D. SERS Experiments
Rh6G, CV, MB, and MG were chosen as the Raman reporters for the SERS study. 4 μL of the
3. RESULTS AND DISCUSSION
A. Characterization of Nanostructures
Figure 2(a) shows the schematic diagram of the synthetic process of lamellar
![]()
Figure 2.Synthesis and characterization of
![]()
Figure 3.Atomic structure of monolayer
XPS analysis was used to validate the stoichiometry of 2D
![]()
Figure 4.(a) XPS analysis of
B. SERS Activity of Hafnium Telluride
![]()
Figure 5.(a) Raw Raman spectra of Rh6G (
The ultrathin 2D nanosheets have smooth surfaces and can produce uniform SERS signals better than rough surfaces [50]. For SERS reproducibility study, we randomly acquired 20 SERS spectral lines of
![]()
Figure 6.(a) Cluster of SERS spectra of Rh6G samples randomly collected at 20 sites on the
Raman mapping was further carried out in a randomly selected region (
![]()
Figure 7.(a) SERS image of Rh6G molecules (
C. Chemical Mechanism of
Chemical enhancement mechanism plays a leading role in SERS of transition metal dichalcogenides [51]. The possible Raman enhancement mechanism of
![]()
Figure 8.Schematic diagram of the photo-induced charge transfer process between
D. SERS Screening of Uric Acid
The excessive UA level is prone to cause gout and even uremia. The detection of UA content in urine has momentous predictive significance for the onset of gout disease. For clinical practice, urea is the biggest interference factor for the SERS detection of UA. We first measured the SERS signals of pure uric acid, urea, and their mixture on
![]()
Figure 9.Mean SERS spectra of pure uric acid, urea, and their mixture on
![]()
Figure 10.(a) SERS detection of UA at different concentrations on
4. CONCLUSIONS
In summary, we have prepared few-layered
References
[1] S. M. Nie, S. R. Emery. Probing single molecules and single nanoparticles by surface-enhanced Raman scattering. Science, 275, 1102-1106(1997).
[2] E. Garcia-Rico, R. A. Alvarez-Puebla, L. Guerrini. Direct surface-enhanced Raman scattering (SERS) spectroscopy of nucleic acids: from fundamental studies to real-life applications. Chem. Soc. Rev., 47, 4909-4923(2018).
[3] S. Hussain, H. Chen, Z. Zhang, H. Zheng. Vibrational spectra and chemical imaging of cyclo[18]carbon by tip enhanced Raman spectroscopy. Chem. Commun., 56, 2336-2339(2020).
[4] J. Yu, M. Yang, Z. Li, C. Liu, Y. Wei, C. Zhang, B. Man, F. Lei. Hierarchical particle-in-quasicavity architecture for ultratrace
[5] W. Zhang, F. Lin, Y. Liu, H. Zhang, T. A. Gilbertson, A. Zhou. Spatiotemporal dynamic monitoring of fatty acid-receptor interaction on single living cells by multiplexed Raman imaging. Proc. Natl. Acad. Sci. USA, 117, 3518-3527(2020).
[6] C. Zong, M. Xu, L. J. Xu, T. Wei, X. Ma, X. S. Zheng, R. Hu, B. Ren. Surface-enhanced Raman spectroscopy for bioanalysis: reliability and challenges. Chem. Rev., 118, 4946-4980(2018).
[7] S. Y. Ding, J. Yi, J. F. Li, B. Ren, D. Y. Wu, R. Panneerselvam, Z. Q. Tian. Nanostructure-based plasmon-enhanced Raman spectroscopy for surface analysis of materials. Nat. Rev. Mater., 1, 16021(2016).
[8] S. Y. Ding, E. M. You, Z. Q. Tian, M. Moskovits. Electromagnetic theories of surface-enhanced Raman spectroscopy. Chem. Soc. Rev., 46, 4042-4076(2017).
[9] C. Li, S. Xu, J. Yu, Z. Li, W. Li, J. Wang, A. Liu, B. Man, S. Yang, C. Zhang. Local hot charge density regulation: vibration-free pyroelectric nanogenerator for effectively enhancing catalysis and
[10] H. S. Su, H. S. Feng, Q. Q. Zhao, X. G. Zhang, J. J. Sun, Y. H. He, S. C. Huang, T. X. Huang, J. H. Zhong, D. Y. Wu, B. Ren. Probing the local generation and diffusion of active oxygen species on a Pd/Au bimetallic surface by tip-enhanced Raman spectroscopy. J. Am. Chem. Soc., 142, 1341-1347(2020).
[11] H. Zhang, S. Duan, P. M. Radjenovic, Z. Q. Tian, J. F. Li. Core-shell nanostructure-enhanced Raman spectroscopy for surface catalysis. Acc. Chem. Res., 53, 729-739(2020).
[12] X. Zhao, C. Liu, J. Yu, Z. Li, L. Liu, C. Li, S. Xu, W. Li, B. Man, C. Zhang. Hydrophobic multiscale cavities for high-performance and self-cleaning surface-enhanced Raman spectroscopy (SERS) sensing. Nanophotonics, 9, 4761-4773(2020).
[13] X. H. Li, S. H. Guo, J. Su, X. G. Ren, Z. Y. Fang. Efficient Raman enhancement in molybdenum disulfide by tuning the interlayer spacing. ACS Appl. Mater. Interfaces, 12, 28474-28483(2020).
[14] X. Ling, W. J. Fang, Y. H. Lee, P. T. Araujo, X. Zhang, J. F. Rodriguez-Nieva, Y. X. Lin, J. Zhang, J. Kong, M. S. Dresselhaus. Raman enhancement effect on two-dimensional layered materials: graphene, h-BN and MoS2. Nano Lett., 14, 3033-3040(2014).
[15] Z. M. Liu, H. L. Chen, Y. L. Jia, W. Zhang, H. N. Zhao, W. D. Fan, W. L. Zhang, H. Q. Zhong, Y. R. Ni, Z. Y. Guo. A two-dimensional fingerprint nanoprobe based on black phosphorus for bio-SERS analysis and chemo-photothermal therapy. Nanoscale, 10, 18795-18804(2018).
[16] Y. Tan, L. N. Ma, Z. B. Gao, M. Chen, F. Chen. Two-dimensional heterostructure as a platform for surface-enhanced Raman scattering. Nano Lett., 17, 2621-2626(2017).
[17] J. A. Dieringer, A. D. McFarland, N. C. Shah, D. A. Stuart, A. V. Whitney, C. R. Yonzon, M. A. Young, X. Y. Zhang, R. P. Van Duyne. Surface enhanced Raman spectroscopy: new materials, concepts, characterization tools, and applications. Faraday Discuss., 132, 9-26(2006).
[18] B. N. J. Persson, K. Zhao, Z. Y. Zhang. Chemical contribution to surface-enhanced Raman scattering. Phys. Rev. Lett., 96, 207401(2006).
[19] P. Q. Lu, Y. Wang, H. L. Xu, X. Y. Wang, N. Ali, J. Q. Zhu, H. Z. Wu. Surface-enhanced Raman scattering on sandwiched structures with gallium telluride. J. Mater. Sci., 55, 10047-10055(2020).
[20] L. Tao, K. Chen, Z. Chen, C. Cong, C. Qiu, J. Chen, X. Wang, H. Chen, T. Yu, W. Xie, S. Deng, J. B. Xu. 1T’ transition metal telluride atomic layers for plasmon-free SERS at femtomolar levels. J. Am. Chem. Soc., 140, 8696-8704(2018).
[21] A. L. Wang, C. Guan, G. Y. Shan, Y. W. Chen, C. L. Wang, Y. C. Liu. A nanocomposite prepared from silver nanoparticles and carbon dots with peroxidase mimicking activity for colorimetric and SERS-based determination of uric acid. Microchim. Acta, 186, 644(2019).
[22] C. Westley, Y. Xu, B. Thilaganathan, A. J. Carnell, N. J. Turner, R. Goodacre. Absolute quantification of uric acid in human urine using surface enhanced Raman scattering with the standard addition method. Anal. Chem., 89, 2472-2477(2017).
[23] F. Yang, P. Sun, H. Zhao, C. Zhao, N. Zhang, Y. Dai. Genetic association and functional analysis of rs7903456 in
[24] K. M. Black, H. Law, A. Aldoukhi, J. Deng, K. R. Ghani. Deep learning computer vision algorithm for detecting kidney stone composition. BJU Int., 125, 920-924(2020).
[25] C. C. Chang, C. H. Wu, L. K. Liu, R. H. Chou, C. S. Kuo, P. H. Huang, L. K. Chen, S. J. Lin. Association between serum uric acid and cardiovascular risk in nonhypertensive and nondiabetic individuals: the Taiwan I-Lan longitudinal aging study. Sci. Rep., 8, 5234(2018).
[26] P. Richette, M. Doherty, E. Pascual, V. Barskova, F. Becce, J. Castaneda, M. Coyfish, S. Guillo, T. Jansen, H. Janssens, F. Liote, C. D. Mallen, G. Nuki, F. Perez-Ruiz, J. Pimentao, L. Punzi, A. Pywell, A. K. So, A. K. Tausche, T. Uhlig, J. Zavada, W. Y. Zhang, F. Tubach, T. Bardin. 2018 updated European league against rheumatism evidence-based recommendations for the diagnosis of gout. Ann. Rheum. Dis., 79, 31-38(2020).
[27] X. H. Dai, X. Fang, C. M. Zhang, R. F. Xu, B. Xu. Determination of serum uric acid using high-performance liquid chromatography (HPLC)/isotope dilution mass spectrometry (ID-MS) as a candidate reference method. J. Chromatogr. B, 857, 287-295(2007).
[28] D. Habibi, A. R. Faraji, A. Gil. A highly sensitive supported manganese-based voltammetric sensor for the electrocatalytic determination of captopril. Sens. Actuators B, 182, 80-86(2013).
[29] Y. W. Tao, X. J. Zhang, J. W. Wang, X. X. Wang, N. J. Yang. Simultaneous determination of cysteine, ascorbic acid and uric acid by capillary electrophoresis with electrochemiluminescence. J. Electroanal. Chem., 674, 65-70(2012).
[30] Q. H. Yan, N. Zhi, L. Yang, G. R. Xu, Q. G. Feng, Q. Q. Zhang, S. J. Sun. A highly sensitive uric acid electrochemical biosensor based on a nano-cube cuprous oxide/ferrocene/uricase modified glassy carbon electrode. Sci. Rep., 10, 10607(2020).
[31] M. T. Alula, P. Lemmens, L. Bo, D. Wulferding, J. Yang, H. Spende. Preparation of silver nanoparticles coated ZnO/Fe3O4 composites using chemical reduction method for sensitive detection of uric acid via surface-enhanced Raman spectroscopy. Anal. Chim. Acta, 1073, 62-71(2019).
[32] E. Gurian, P. Giraudi, N. Rosso, C. Tiribelli, D. Bonazza, F. Zanconati, M. Giuricin, S. Palmisano, N. de Manzini, V. Sergo, A. Bonifacio. Differentiation between stages of non-alcoholic fatty liver diseases using surface-enhanced Raman spectroscopy. Anal. Chim. Acta, 1110, 190-198(2020).
[33] R. S. Juang, Y. W. Cheng, W. T. Chen, K. S. Wang, C. C. Fu, S. H. Liu, R. J. Jeng, C. C. Chen, M. C. Yang, T. Y. Liu. Silver nanoparticles embedded on mesoporous-silica modified reduced graphene-oxide nanosheets for SERS detection of uremic toxins and parathyroid hormone. Appl. Surf. Sci., 521, 146372(2020).
[34] R. K. Saravanan, T. K. Naqvi, S. Patil, P. K. Dwivedi, S. Verma. Purine-blended nanofiber woven flexible nanomats for SERS-based analyte detection. Chem. Commun., 56, 5795-5798(2020).
[35] X. Ling, L. M. Xie, Y. Fang, H. Xu, H. Zhang, J. Kong, M. S. Dresselhaus, J. Zhang, Z. Liu. Can graphene be used as a substrate for Raman enhancement?. Nano Lett., 10, 553-561(2010).
[36] C. Qiu, H. Zhou, H. Yang, M. Chen, Y. Guo, L. Sun. Investigation of
[37] C. Cheng, J. T. Sun, X. R. Chen, S. Meng. Hidden spin polarization in the 1T-phase layered transition-metal dichalcogenides MX2(M = Zr, Hf; X = S, Se, Te). Sci. Bull., 63, 85-91(2018).
[38] B. Harbrecht, M. Conrad, T. Degen, R. Herbertz. Synthesis and crystal structure of Hf2Te. J. Alloy. Compd., 255, 178-182(1997).
[39] S. Aminalragia-Giamini, J. Marquez-Velasco, P. Tsipas, D. Tsoutsou, G. Renaud, A. Dimoulas. Molecular beam epitaxy of thin HfTe2 semimetal films. 2D Mater., 4, 015001(2017).
[40] M. Chennabasappa, M. Lahaye, B. Chevalier, C. Labrugere, O. Toulemonde. A successful process to prevent corrosion of rich Gd-based room temperature magnetocaloric material during ageing. J. Alloy. Compd., 850, 156554(2021).
[41] R. Lai, M. Wei, J. Wang, K. Zhou, X. Qiu. Temperature dependence of resistive switching characteristics in NiO(111) films on metal layer. J. Phys. D, 54, 015101(2021).
[42] H. Hichem, A. Djamila, A. Hania. Optical, electrical and photoelectrochemical characterization of electropolymerized poly methylene blue on fluorine doped tin oxide conducting glass. Electrochim. Acta, 106, 69-74(2013).
[43] S. Lin, W. Hasi, X. Lin, S. Han, T. Xiang, S. Liang, L. Wang. Lab-on-capillary platform for on-site quantitative SERS analysis of surface contaminants based on Au@4-MBA@Ag core-shell nanorods. ACS Sens., 5, 1465-1473(2020).
[44] D. Pristinski, S. L. Tan, M. Erol, H. Du, S. Sukhishvili.
[45] J. Lin, L. Liang, X. Ling, S. Zhang, N. Mao, N. Zhang, B. G. Sumpter, V. Meunier, L. Tong, J. Zhang. Enhanced Raman scattering on in-plane anisotropic layered materials. J. Am. Chem. Soc., 137, 15511-15517(2015).
[46] J. P. Fraser, P. Postnikov, E. Miliutina, Z. Kolska, R. Valiev, V. Svorcik, O. Lyutakov, A. Y. Ganin, O. Guselnikova. Application of a 2D molybdenum telluride in SERS detection of biorelevant molecules. ACS Appl. Mater. Interfaces, 12, 47774-47783(2020).
[47] C. Jiang, Y. Wei, P. Zhao, P. Wang, Y. Fang, L. Zhang. Investigation of surface-enhanced Raman spectroscopy on the substrates of telluride 2D material. Eur. Phys. J. Plus, 135, 671(2020).
[48] K. Wang, Z. Guo, Y. Li, Y. Guo, H. Liu, W. Zhang, Z. Zou, Y. Zhang, Z. Liu. Few-layer NbTe2 nanosheets as substrates for surface-enhanced Raman scattering analysis. ACS Appl. Nano Mater., 3, 11363-11371(2020).
[49] A. Sarycheva, T. Makaryan, K. Maleski, E. Satheeshkumar, A. Melikyan, H. Minassian, M. Yoshimura, Y. Gogotsi. Two-dimensional titanium carbide (MXene) as surface-enhanced Raman scattering substrate. J. Phys. Chem. C, 121, 19983-19988(2017).
[50] H. Wu, X. Zhou, J. Li, X. Li, B. Li, W. Fei, J. Zhou, J. Yin, W. Guo. Ultrathin molybdenum dioxide nanosheets as uniform and reusable surface-enhanced Raman spectroscopy substrates with high sensitivity. Small, 14, 1802276(2018).
[51] J. Langer, D. J. de Aberasturi, J. Aizpurua, R. A. Alvarez-Puebla, B. Auguie, J. J. Baumberg, G. C. Bazan, S. E. J. Bell, A. Boisen, A. G. Brolo, J. Choo, D. Cialla-May, V. Deckert, L. Fabris, K. Faulds, F. J. G. de Abajo, R. Goodacre, D. Graham, A. J. Haes, C. L. Haynes, C. Huck, T. Itoh, M. Ka, J. Kneipp, N. A. Kotov, H. Kuang, E. C. Le Ru, H. K. Lee, J. F. Li, X. Y. Ling, S. A. Maier, T. Mayerhofer, M. Moskovits, K. Murakoshi, J. M. Nam, S. Nie, Y. Ozaki, I. Pastoriza-Santos, J. Perez-Juste, J. Popp, A. Pucci, S. Reich, B. Ren, G. C. Schatz, T. Shegai, S. Schlucker, L. L. Tay, K. G. Thomas, Z. Q. Tian, R. P. Van Duyne, T. Vo-Dinh, Y. Wang, K. A. Willets, C. Xu, H. Xu, Y. Xu, Y. S. Yamamoto, B. Zhao, L. M. Liz-Marzan. Present and future of surface-enhanced Raman scattering. ACS Nano, 14, 28-117(2020).
[52] W. Ji, L. Li, W. Song, X. Wang, B. Zhao, Y. Ozaki. Enhanced Raman scattering by ZnO superstructures: synergistic effect of charge transfer and Mie resonances. Angew. Chem., 58, 14452-14456(2019).
[53] E. Kazuma, J. Jung, H. Ueba, M. Trenary, Y. Kim. STM studies of photochemistry and plasmon chemistry on metal surfaces. Prog. Surf. Sci., 93, 163-176(2018).
[54] N. J. Kim, J. Kim, J. B. Park, H. Kim, G. C. Yi, S. Yoon. Direct observation of quantum tunnelling charge transfers between molecules and semiconductors for SERS. Nanoscale, 11, 45-49(2018).
[55] J. Lin, Y. Shang, X. X. Li, J. Yu, X. T. Wang, L. Guo. Ultrasensitive SERS detection by defect engineering on single Cu2O superstructure particle. Adv. Mater., 29, 1604797(2016).
[56] Z. Yu, W. Yu, J. Xing, R. A. Ganeev, W. Xin, J. Cheng, C. Guo. Charge transfer effects on resonance-enhanced Raman scattering for molecules adsorbed on single-crystalline perovskite. ACS Photon., 5, 1619-1627(2018).
[57] X. Wang, W. Shi, G. She, L. Mu. Using Si and Ge nanostructures as substrates for surface-enhanced Raman scattering based on photoinduced charge transfer mechanism. J. Am. Chem. Soc., 133, 16518-16523(2011).
[58] K. Chen, X. Y. Zhang, D. R. MacFarlane. Ultrasensitive surface-enhanced Raman scattering detection of urea by highly ordered Au/Cu hybrid nanostructure arrays. Chem. Commun., 53, 7949-7952(2017).


Set citation alerts for the article
Please enter your email address

© Copyright 2018-2021 | Chinese Laser Press. All Rights Reserved 沪ICP备15018463号-20