
Hongyi Jiang, Xinyi Zhao, Tianqing Li, Qiang Zhu, Dan Wang, Yucheng Lei. Microstructure and Properties of 35.8%Fe-20%Ti-20%Al-24%Cr- 0.2%Y2O3 Coatings Prepared by Laser Cladding[J]. Laser & Optoelectronics Progress, 2022, 59(19): 1916003
- Laser & Optoelectronics Progress
- Vol. 59, Issue 19, 1916003 (2022)
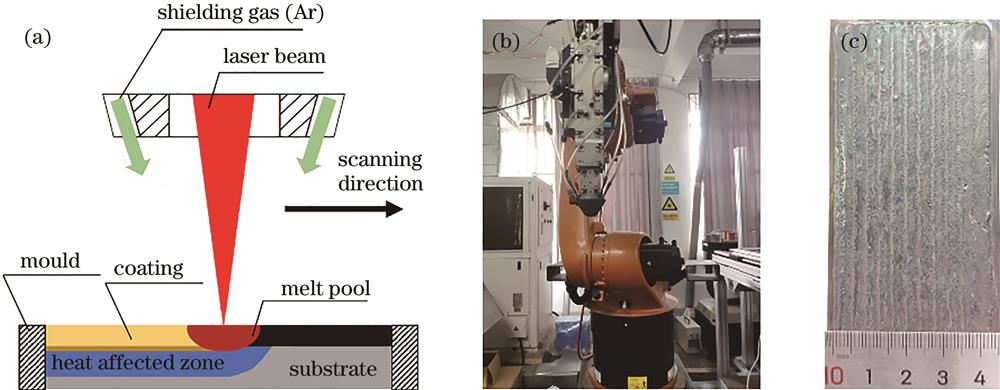
Fig. 1. Laser cladding experiment. (a) Laser cladding with preplaced powder; (b) 6 kW laser processing system; (c) macro-morphology of coating
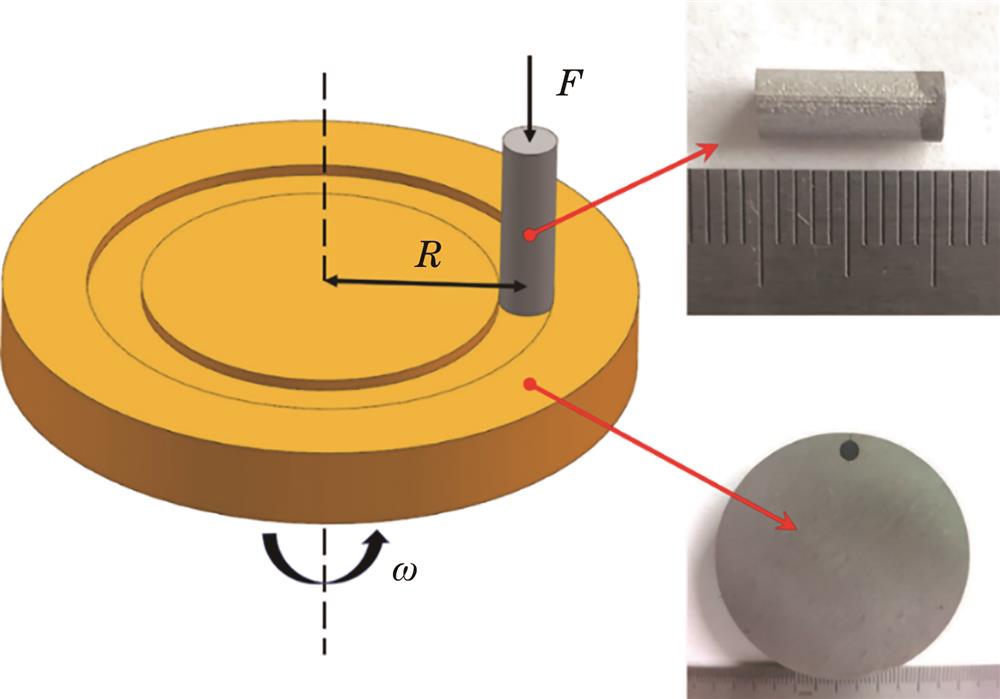
Fig. 2. Diagram of wear test equipment
Fig. 3. XRD pattern of alloy coating
Fig. 4. Metallographic images. (a) Transition area; (b) coating
Fig. 5. EBSD results of coating structure. (a) EBSD morphology of coating cross section; (b) coating grain size distribution
Fig. 6. Distributions of EDS element in coating cross section
Fig. 7. Element distributions in coating and transition zone. (a) Element distribution curves of coating and transition zone; (b) elemental composition of transition zone
Fig. 8. Hardness analysis of coating-substrate. (a) Section hardness change of coating-substrate; (b) EBSD morphology of transition cross section; (c) phase distribution of transition cross section
Fig. 9. Wearing surface morphologies changes of the pins before and after wear test. (a) 304 stainless steel pin surface before wear; (b) 304 stainless steel pin surface after wear; (c) coating pin surface before wear; (d) coating pin surface after wear
Fig. 10. Morphologies and EDS element analysis of stainless steel pin wearing disk. (a) Oxidative wear area; (b) adhesive wear area
Fig. 11. Morphologies and EDS element analysis of alloy coating wearing disk
Fig. 12. Comparison of average friction coefficients between coating and 304 stainless steel
|
Table 1. Chemical composition of 304 stainless steel
|
Table 2. Chemical composition of Fe-Ti-Al-Cr-Y2O3 mixed powder
|
Table 3. Parameters in laser cladding process
|
Table 4. Volume and mass loss of pins

Set citation alerts for the article
Please enter your email address
© Copyright 2018-2021 | Chinese Laser Press. All Rights Reserved 沪ICP备15018463号-20