• Photonics Research
  • Vol. 10, Issue 8, 1947 (2022)
Xin Wang1,2, Yuan Sun1,3,*, and Liang Liu1,4,*
Author Affiliations
  • 1CAS Key Laboratory of Quantum Optics and Center of Cold Atom Physics, Shanghai Institute of Optics and Fine Mechanics, Chinese Academy of Sciences, Shanghai 201800, China
  • 2Center of Materials Science and Optoelectronics Engineering, University of Chinese Academy of Sciences, Beijing 100049, China
  • 3e-mail: yuansun@siom.ac.cn
  • 4e-mail: liang.liu@siom.ac.cn
  • show less
    DOI: 10.1364/PRJ.453159 Cite this Article Set citation alerts
    Xin Wang, Yuan Sun, Liang Liu, "Realizing fast temperature measurement and simulating Maxwell’s demon with nearly nondestructive detection in cold atoms," Photonics Res. 10, 1947 (2022) Copy Citation Text show less
    (a) Schematic of the experiment. The cold atom ensemble is prepared by a uniformly diffused cooling laser. A polarizing beam splitter (PBS), polarizers (POL), and a half-wave plate (HWP) are employed to combine the polarizing laser and the repumping laser for the labeling process. A quarter-wave plate turns the labeling lasers and the probe laser into circular polarization. The probe laser propagates and eventually arrives at a photodetector (PD). The labeling lasers and probe laser are concentric and aligned along the direction of gravity. No bias magnetic field is required. (b) Theory curve of the absorption signal for cold atoms of 20 μK as the 2D temperature. (c) Relevant energy levels of Rb87 D2 line for the experiment, including the details of Zeeman sub-states and laser polarizations for the nearly nondestructive detection method. The probe laser drives a cycling transition when the population is concentrated in |F=2,mF=2⟩.
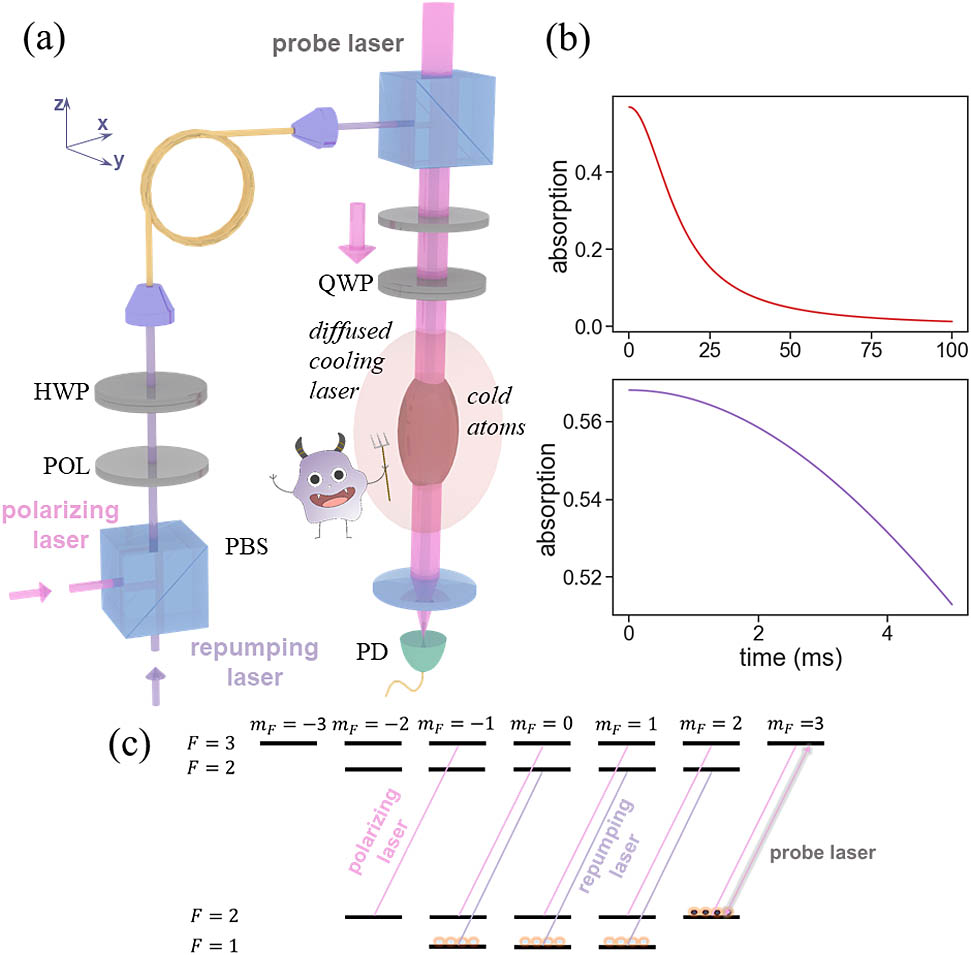
    Fig. 1. (a) Schematic of the experiment. The cold atom ensemble is prepared by a uniformly diffused cooling laser. A polarizing beam splitter (PBS), polarizers (POL), and a half-wave plate (HWP) are employed to combine the polarizing laser and the repumping laser for the labeling process. A quarter-wave plate turns the labeling lasers and the probe laser into circular polarization. The probe laser propagates and eventually arrives at a photodetector (PD). The labeling lasers and probe laser are concentric and aligned along the direction of gravity. No bias magnetic field is required. (b) Theory curve of the absorption signal for cold atoms of 20 μK as the 2D temperature. (c) Relevant energy levels of Rb87 D2 line for the experiment, including the details of Zeeman sub-states and laser polarizations for the nearly nondestructive detection method. The probe laser drives a cycling transition when the population is concentrated in |F=2,mF=2.
    Sample time sequence for our experiment of fast temperature measurement with nearly nondestructive detection. The pumping laser is resonant with the transition of 52S1/2,F=2↔52P3/2,F=2.
    Fig. 2. Sample time sequence for our experiment of fast temperature measurement with nearly nondestructive detection. The pumping laser is resonant with the transition of 52S1/2,F=252P3/2,F=2.
    Sample time sequence for our experiment of simulating Maxwell’s demon in terms of velocity-dependent labeling. A mechanical shutter is employed to ensure the labeling lasers are stopped completely, such that we intentionally keep a waiting period up to several milliseconds at the end of cooling stage for it to stabilize, which is not necessary in theory. We omit this extra gap time in this graph.
    Fig. 3. Sample time sequence for our experiment of simulating Maxwell’s demon in terms of velocity-dependent labeling. A mechanical shutter is employed to ensure the labeling lasers are stopped completely, such that we intentionally keep a waiting period up to several milliseconds at the end of cooling stage for it to stabilize, which is not necessary in theory. We omit this extra gap time in this graph.
    Theory curves according to Eq. (1).
    Fig. 4. Theory curves according to Eq. (1).
    Obtain temperature from a single trace of experimental data, costing less than 1 ms. The inset shows the details of the first 200 μs. This probe laser pulse starts at 3.3 ms after the labeling process, mostly because of waiting for the mechanical shutter of labeling lasers to fully close. The method of trust region reflective is employed for the fitting.
    Fig. 5. Obtain temperature from a single trace of experimental data, costing less than 1 ms. The inset shows the details of the first 200 μs. This probe laser pulse starts at 3.3 ms after the labeling process, mostly because of waiting for the mechanical shutter of labeling lasers to fully close. The method of trust region reflective is employed for the fitting.
    Result of dual-pulse experiment, obtained from a single experimental trial. The inset shows the detailed data of the two pulses, respectively. Here the radius of labeled area Rl is 0.64 mm, and the first probe pulse starts at 4 ms after the labeling process. The overall fitted temperature is 24.83 μK with uncertainties less than 0.1 μK.
    Fig. 6. Result of dual-pulse experiment, obtained from a single experimental trial. The inset shows the detailed data of the two pulses, respectively. Here the radius of labeled area Rl is 0.64 mm, and the first probe pulse starts at 4 ms after the labeling process. The overall fitted temperature is 24.83 μK with uncertainties less than 0.1 μK.
    Result of dual-pulse experiment with a relatively short time delay between the two probe pulses.
    Fig. 7. Result of dual-pulse experiment with a relatively short time delay between the two probe pulses.
    Theory curve that describes the filtering of colder atoms in terms of 2D temperature, with Rl=0.64 mm and d=2.60 mm. (a) Details of the tail part. (b) Experimental dual-pulse detection result with initial temperature about 25.0 μK, also starting at 4 ms after labeling.
    Fig. 8. Theory curve that describes the filtering of colder atoms in terms of 2D temperature, with Rl=0.64  mm and d=2.60  mm. (a) Details of the tail part. (b) Experimental dual-pulse detection result with initial temperature about 25.0 μK, also starting at 4 ms after labeling.
    (a) Cartoon of atoms traveling through the region of labeling lasers, which leads to velocity-dependent labeling. (b) Relation between τm,vm and repumping laser power. If the Clebsch–Gordon coefficients or the actual Gaussian beam profile is included into consideration, the result does not change significantly. (c) Result of the velocity-dependent labeling experiment, showing the ability to distinguish fast and slow atoms in the sense of Maxwell’s demon through experiment. From the viewpoint of classical mechanics, this is analogous to the case of separating hotter and colder atoms into isolated V/2 segments, respectively, from an original containment of volume V. If we set all the labeling times at 10 ms, the behavior is similar. The inset shows the details of 2 nW data point, which is smoothed with a rolling average of every five points.
    Fig. 9. (a) Cartoon of atoms traveling through the region of labeling lasers, which leads to velocity-dependent labeling. (b) Relation between τm,vm and repumping laser power. If the Clebsch–Gordon coefficients or the actual Gaussian beam profile is included into consideration, the result does not change significantly. (c) Result of the velocity-dependent labeling experiment, showing the ability to distinguish fast and slow atoms in the sense of Maxwell’s demon through experiment. From the viewpoint of classical mechanics, this is analogous to the case of separating hotter and colder atoms into isolated V/2 segments, respectively, from an original containment of volume V. If we set all the labeling times at 10 ms, the behavior is similar. The inset shows the details of 2 nW data point, which is smoothed with a rolling average of every five points.
    j|g,j|e,jΩj
    1|F=1,mF=1|F=2,mF=016Ωr
    2|F=1,mF=0|F=2,mF=+112Ωr
    3|F=1,mF=+1|F=2,mF=+2Ωr
    Table 1. Rabi Frequencies for the Transitions Associated with the Repumping Laser in the Labeling Interaction Processa
    j|g,j|e,jΩj
    4|F=2,mF=2|F=3,mF=1115Ωp
    5|F=2,mF=1|F=3,mF=015Ωp
    6|F=2,mF=+0|F=3,mF=+125Ωp
    7|F=2,mF=+1|F=3,mF=+223Ωp
    8|F=2,mF=+2|F=3,mF=+3Ωp
    Table 2. Rabi Frequencies for the Transitions Associated with the Polarizing Laser in the Labeling Interaction Processa
    Xin Wang, Yuan Sun, Liang Liu, "Realizing fast temperature measurement and simulating Maxwell’s demon with nearly nondestructive detection in cold atoms," Photonics Res. 10, 1947 (2022)
    Download Citation