• Chinese Optics Letters
  • Vol. 15, Issue 12, 120602 (2017)
Qing Li1, He Huang1, Feng Lin2, and Xingkun Wu1、*
Author Affiliations
  • 1State Key Laboratory of Modern Optical Instrumentation, Department of Optical Engineering, Zhejiang University, Hangzhou, Zhejiang 310027, China
  • 2School of Computer Engineering, Nanyang Technological University, 637553, Singapore
  • show less
    DOI: 10.3788/COL201715.120602 Cite this Article Set citation alerts
    Qing Li, He Huang, Feng Lin, Xingkun Wu. Real-time measurement of nano-particle size using differential optical phase detection[J]. Chinese Optics Letters, 2017, 15(12): 120602 Copy Citation Text show less
    Schematic setup of optical differential detection of nanometer-sized particles.
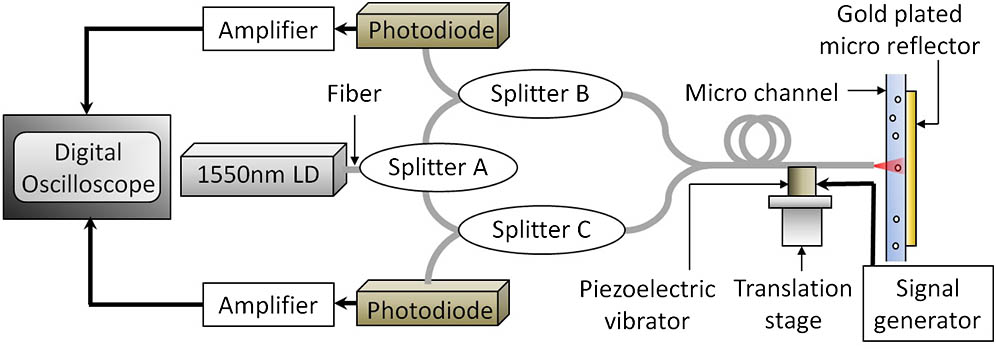
    Fig. 1. Schematic setup of optical differential detection of nanometer-sized particles.
    Schematic of optical differential detection of nano-particles in a microfluidic channel using two tapered fibers for optical interference.
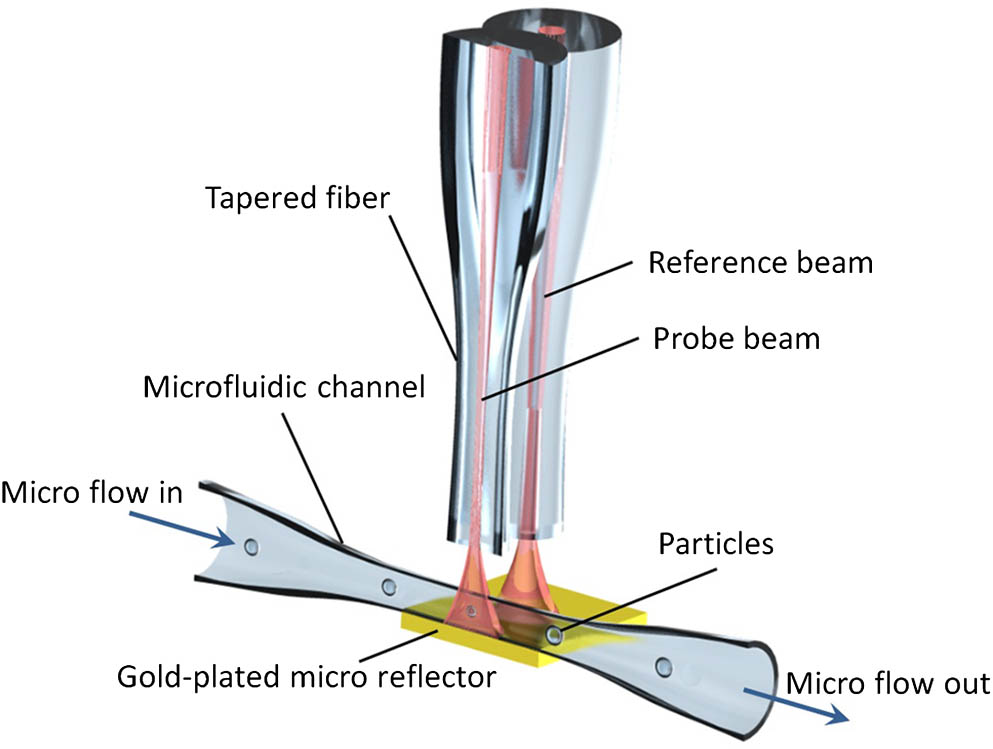
    Fig. 2. Schematic of optical differential detection of nano-particles in a microfluidic channel using two tapered fibers for optical interference.
    (Color online) Differential waveforms of experimental signal, corresponding frames from a video recording with a test particle passing through the probe beam at four positions a–d.
    Fig. 3. (Color online) Differential waveforms of experimental signal, corresponding frames from a video recording with a test particle passing through the probe beam at four positions a–d.
    (Color online) In each chart a–d, the upper two curves refer to the direct measured PGC modulation waveforms, and the middle two curves refer to the normalized measured PGC modulation waveforms, while the lower green curve refers to the differential normalized waveform. Four graphs correspond to the four positions recorded by screen grabs a–d in Fig. 3, indicating change in waveforms as the test particle passing through the signal beam.
    Fig. 4. (Color online) In each chart a–d, the upper two curves refer to the direct measured PGC modulation waveforms, and the middle two curves refer to the normalized measured PGC modulation waveforms, while the lower green curve refers to the differential normalized waveform. Four graphs correspond to the four positions recorded by screen grabs a–d in Fig. 3, indicating change in waveforms as the test particle passing through the signal beam.
    (Color online) Measured phase shift as a function of the diameter of nano-particles (red, 900 nm polystyrene nanospheres; gray, 800 nm polystyrene nanospheres; green, 600 nm polystyrene nanospheres; blue, 500 nm polystyrene nanospheres; purple, 300 nm polystyrene nanospheres; yellow, 200 nm polystyrene nanospheres) as a function of the particles’ diameters with error bars of 14.5%, 14.8%, 19.5%, 20.3%, 22.0%, and 23.8%, respectively, while the dotted curve shows predicted values from the theoretical model[25].
    Fig. 5. (Color online) Measured phase shift as a function of the diameter of nano-particles (red, 900 nm polystyrene nanospheres; gray, 800 nm polystyrene nanospheres; green, 600 nm polystyrene nanospheres; blue, 500 nm polystyrene nanospheres; purple, 300 nm polystyrene nanospheres; yellow, 200 nm polystyrene nanospheres) as a function of the particles’ diameters with error bars of 14.5%, 14.8%, 19.5%, 20.3%, 22.0%, and 23.8%, respectively, while the dotted curve shows predicted values from the theoretical model[25].
    Qing Li, He Huang, Feng Lin, Xingkun Wu. Real-time measurement of nano-particle size using differential optical phase detection[J]. Chinese Optics Letters, 2017, 15(12): 120602
    Download Citation