We demonstrate a size sensing technique for nano-particles using optical differential phase measurement by a dual fiber interferometer through phase-generated carrier (PGC) demodulation. Nano-particle diameters are obtained from the differential phase shift as a result of adding an optical scattering perturbation into two-beam interference. Polystyrene nano-particles with diameters from 200 to 900 nm in a microfluidic channel are detected using this technique to acquire real-time particle diameters. Compared with amplitude sensing with over 10 mW of laser irradiance, particle sizing by PGC phase sensing can be achieved at a laser power as low as 1.18 mW. We further analyze major sources of noise in order to improve the limits of detection. This sensing technique may find a broad range of applications from the real-time selection of biological cell samples to rare cell detection in blood samples for early cancer screening.
Rapid particle size detection has gained increasing importance in many modern industries and scientific researches. Particle size distribution analyses in municipal, industrial, agricultural, biological, and atmospheric fields, includes the analysis of wastewater[1,2], soil[3], atmospheric aerosols[4–6], industrial processes, biological systems, and cancer cell detection/analysis[7–11]. Optical detection methods have garnered particular interest due to the convenience of setup and non-invasive properties.
Consequently, the most desired features for non-invasive rapid optical detection include operation in real-time with low laser power. The real-time processing capability can provide fast particle filtering or sorting, which is much needed in modern microfluidic and lab-on-a-chip devices, while low emitted power can significantly reduce the risk of photo damage to biological samples, including cells, proteins, and DNA[12–14].
However, most current optical size detection techniques are limited. Some examples of previous approaches include detecting the scattered field amplitude from a particle irradiated with a laser at about 100 mW[15], point measurements of time-resolved laser-induced incandescence (LII) signals ( per pulse)[16–18], particle sizing and flow measurement based on signal feedback and self-mixing in laser diodes (25 mW)[19], nano-particle detection and sizing by silicon photonic microring resonators (not real-time for flowing particles in microfluidic channels)[20,21], particle size analysis of turbid media utilizing wavelength-dependent elastic scattering white light spectra (not real-time)[22], and dynamic image analysis (DIA) to detect non-spherical particles (not real-time)[23]. All of the above techniques either require over tens of milliwatts of laser power or are not suitable for real-time measurement for particles passing through microfluidic channels.
Sign up for Chinese Optics Letters TOC. Get the latest issue of Chinese Optics Letters delivered right to you!Sign up now
We propose in this Letter a technique of differential optical detection by phase-generated carrier (PGC) demodulation, which is capable of optical particle size detection both in real-time and at very low light power levels. We demonstrate that particle diameter can be resolved from instantaneous phase shifts caused by perturbation of scattering from nano-particles, as detected by differential phase sensing using two side-by-side fiber interferometers through PGC demodulation. Utilizing this method, particle diameters ranging from micrometers down to 200 nm can be resolved with laser power as low as 1.18 mW. The method can also measure real-time nanometer size particles in continuous fluid flow through the detection of differential optical path length changes between two phase modulated laser beams directed at particles and a reference micro-reflector. Through PGC demodulation, differential interference signals were utilized to obtain particle sizes. Differential sensing was employed to minimize the effect of noise from fiber vibration, laser phase noise, and other system response defects. We believe this is a promising technique with particular significance in bioinstrumentation, including cellular detection of rare cancer cells in blood, fast sorting of viruses, and real-time analysis of antigen–antibody binding interactions in bio-chips.
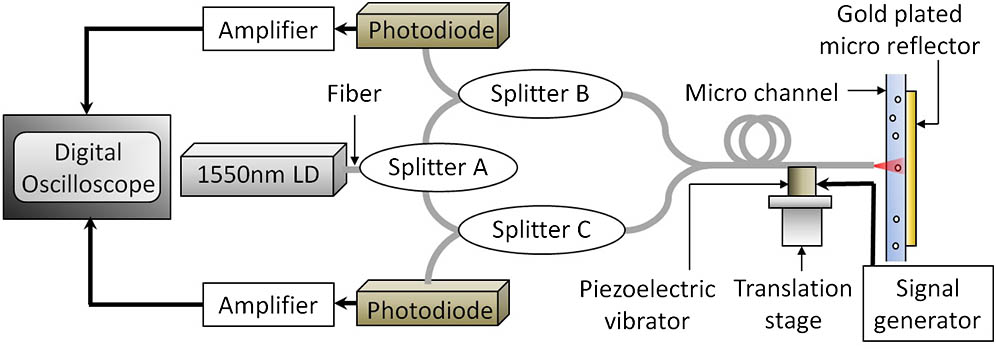
The underlying principle for differential phase-based optical particle size detection is phase modulation and demodulation of interference signals, where two fiber interferometer signals are contrasted to obtain a stable low-noise phase signal. Figure 1 displays a schematic of the experimental setup, where a 1550 nm laser beam [distributed feedback (DFB) laser diode LP1550-SAD2, Thorlabs] was split by a fiber power splitter (splitter A). Each of the two fiber outputs from splitter A was then connected to one split end on the return path of two further fiber splitters (splitters B and C), as shown in Fig. 1. The two beams from splitters B and C were separately delivered to both a particle probe and reference using tapered fiber tips. The delivery ends of the two fibers from splitters B and C are aligned side-by-side, as shown in Fig. 2, and mounted together on a piezoelectric vibrator controlled by a signal generator (33250A, Agilent, USA) at a modulation frequency of 2.5 kHz. This produces two beams with the same phase modulation. The probe beam (splitter B) was delivered to a microfluidic channel[24], where the signal beam was partially scattered and subsequently reflected back with a micro-reflector. The reference beam (splitter C) was delivered to a micro-reflector directly beside the microfluidic channel. This setup ensured that the reference beam transits the same optical path, was subject to the same vibrations as the probe beam, and only differed in its lack of interaction with the microfluidic channel. Two identical photodiodes (FGA01FC, Thorlabs, USA) were connected to the fiber splitters B and C to collect interference signals, which were then amplified, normalized, and differentiated in a high resolution digital oscilloscope (Picoscope 4262, 16-bit 5 MHz dual channel, Pico Technology, UK). The output power from the probe fiber tip was measured to be 1.18 mW. In addition, the setup was air-cushioned to stabilize the interference waveforms through external vibration isolation.
Figure 1.Schematic setup of optical differential detection of nanometer-sized particles.
Figure 2 shows a detailed view of the beam paths around fiber tapers and microfluidic channels. As the two tapered fiber ends oscillated with the piezoelectric vibrator, the optical path lengths are changed equally, forming two contrast beams with the same PGC phase modulation. The probe beam that passed through the samples to be measured in fluid was partially recollected by the same taper fiber after being reflected back by the gold-plated reflector. The reference beam was emitted to the same gold-plated micro-reflector just beside the microfluidic channel and was also re-collected to form a return reference beam with a similar condition as the probe beam. Two post-interference signals were recorded, normalized, and differentiated by the digital oscilloscope. The phase information of the two interferences was resolved using waveform fitting. As a nano-particle passed through the probe beam, its scattered light was collected by the tapered fiber perturbed the beam interference, resulting in a deformation in the interference waveform. By differentiating the phase of the perturbed interference signal beam with the unperturbed reference signal, the phase shift was obtained to calculate the size of the passing particle in real-time.
The differential signal is denoted as ; where represents the normalization process, refers to the waveforms of and after normalization, and is the phase shift due to light scattering by passing particles. The interference intensity is denoted as when the beam passes no particle, while denotes intensity when there is a particle passing through the probe beam.
denotes the electrical field of the returning beam that is after reflection and re-collection by the fiber end face, while denotes the electrical field of the probe beam that passes through the microfluidic channel and is partially reflected by both the particle and the micro-reflector. Then, , and . The beam intensity is calculated as where ; and are the frequency and initial phase of PGC modulation, respectively. is the starting phase of the light interference; is the modulation depth, proportional to the oscillation amplitude of piezoelectric vibrator.
When a particle travels through the probe beam, it gives a scattered light labeled for an amplitude scattering coefficient of the particle. The interference intensity received by the detector is thus calculated as where denotes the phase shift due to perturbation of particle scattering; is the mirror reflectivity in the presence of the particle. The phase difference between Eqs. (2) and (3), caused by , , and , has a positive correlation with the size of the particle in a certain range[25].
In the process of this differential phase measurement, we first normalize waveforms received from the two interferometers, which removes the difference of amplitude between and . Differencing between and after normalization preserves the phase change information, but eliminates most common-mode noise sources, including laser power, phase fluctuation, variations in the distance between the microfluidic channel and fiber probes, and fiber vibration noises. As a result, the phase change can be detected from the differential signal to a high resolution, as the differential signal empirically appears as a quiescent horizontal baseline in the absence of the particle, making the signal noise floor decline by two orders of magnitude.
A 25 μm diameter microfluidic channel was used in our experimental setup to minimize signal variation from varying particle trajectories while flowing inside the microfluidic channel. The tapered fiber has a diameter of 60 μm. Nanospheres were injected into regions between the tapered fiber and the micro reflector by using a digital syringe dispenser.
The waveforms of the differential phase shift when a polystyrene nanosphere with a diameter of 900 nm (Duke 3000, Thermo Scientific, USA) passed through the probe beam are shown in Fig. 3 (left), with an enlarged view indicating a clear perturbation to the PGC interference signal. In Fig. 3, four different particle positions were used to display corresponding waveforms (right insets a to d). The red dotted line is the central axis of the probe fiber, while the white dashed lines outline two fibers as the probe fiber is close to readers, sheltering the reference fiber behind. Maximum differential phase shift was observed when the particle is at the center of the signal beam, which is used for calculating particle size.
Figure 3.(Color online) Differential waveforms of experimental signal, corresponding frames from a video recording with a test particle passing through the probe beam at four positions a–d.
Figure 4 shows measured PGC modulated waveforms, corresponding to normalized waveforms and differential normalized waveforms recorded in the digital oscilloscope as the test particle moved across the signal beam in four positions, as illustrated in Fig. 3. The normalized waveforms eliminate the influence of amplitude, such that the waveform differential is only related to the phase perturbation caused by the test particle. Two identical high resolution detectors were used, and the differential waveform was manually adjusted to a horizontal zeroed line in the absence of the test particle by fine manipulation of the angle between the transmitting light from two fiber probers and the gold-plated micro-reflector. As long as the phase of the signal beam and the reference beam are nearly identical, the differential waveform is highly sensitive to the phase change of the original PGC modulated waveform. The phase change can be detected with a higher resolution differentially in comparison with the case without differential detection, making the noise floor decline from to , and the corresponding SNR increases from 13 to 33 dB.
Figure 4.(Color online) In each chart a–d, the upper two curves refer to the direct measured PGC modulation waveforms, and the middle two curves refer to the normalized measured PGC modulation waveforms, while the lower green curve refers to the differential normalized waveform. Four graphs correspond to the four positions recorded by screen grabs a–d in Fig. 3, indicating change in waveforms as the test particle passing through the signal beam.
The 900 nm polystyrene nanospheres were first tested in the aforementioned setup, and Fig. 5 showed their diameters as a function of differential phase shifts (red circles). Particle concentration was optimized to ensure observations of individual nanospheres with proper time-of-flight. It is noted that the experiment result agrees with the theoretical calculation within a 15% error.
Figure 5.(Color online) Measured phase shift as a function of the diameter of nano-particles (red, 900 nm polystyrene nanospheres; gray, 800 nm polystyrene nanospheres; green, 600 nm polystyrene nanospheres; blue, 500 nm polystyrene nanospheres; purple, 300 nm polystyrene nanospheres; yellow, 200 nm polystyrene nanospheres) as a function of the particles’ diameters with error bars of 14.5%, 14.8%, 19.5%, 20.3%, 22.0%, and 23.8%, respectively, while the dotted curve shows predicted values from the theoretical model[25].
The applicability of this technique for nano-sized particles was further tested for polystyrene nanospheres of 800, 600, 500, 300, and 200 nm (Duke 3000, Thermo Scientific, USA) that were used in the form of continuous fluid in the experiment; the measured results are shown in Fig. 5 along with that calculated from the theoretical model. The phase shift is observed to be monotonically proportional to the particle diameter, which agrees with the theoretical model.
Figure 5 displays the particle diameters ranging from 200 to 900 nm that can be resolved in real-time at a laser power of only 1.18 mW. The experimental measurement error from theoretical models ranged from 14.5% to 23.8%. Since the trajectory of the test particle will frequently deviate from the path with maximal phase change, the error of the measured phase shift value often tends to be less than the theoretical value, as shown in Fig. 5.
In this detection technique, the various trajectories that a particle may take and the photocurrent-to-voltage conversion process will cause signal variation. The particle trajectories variation is nearly random and can be better restricted in a narrower microfluidic channel. Compared to other spatial light detection approaches, the interferometric differential technique is not influenced by the Brownian motion that affects the time at which maximum scattering occurs, but not its value. As a result, this differential interferometric method produces narrower distributions.
The finite width of the individual particle distributions originates from the distribution of particle trajectories in the microchannel, as well as the actual size distribution of the particles. The standard deviations of size distribution are 4.1, 4.8, 12, 8.6, 5.3, and 4.7 nm for the tested standard particles with nominal diameters of 900, 800, 600, 500, 300, and 200 nm. Therefore, the measured distributions are still wider than nominal factory specifications. Narrower distributions can be obtained by further reducing the dimensions of the microchannels.
The experimental measurement system has a few sources of instability, which can affect the detection noise level. This includes the phase noise of the laser diode, fluctuations in laser wavelength, the stability of the piezoelectric vibrator and other mechanical supports, the vibration disturbance of fibers, and especially the detector noise. Differential detection can minimize most of the common-mode noises, since the signal and the reference beams undergo the same conditions except at the microfluidic channel. To obtain accurate results, low-noise detectors are required, and matching characteristics of the two detectors is key to obtaining virtually zero modulation of the waveform in the absence of a particle. However, simply increasing the laser power cannot improve the accuracy of detection directly, because only optical phase related factors, such as optical path difference, can influence the detection results.
The measurement data confirms that the differential phase detection provides signal stabilization and noise reduction. Further experiments are in progress to improve size sensitivity by optimizing the tapered fiber and microfluidic channel properties.
In conclusion, we demonstrate that the size of nano-particles in a continuously flowing fluid sample can be resolved in real-time by a differential dual fiber interferometer with phase modulation and demodulation. Particle diameters ranging from 200 to 900 nm are successfully measured at a low laser power. The method is an advantage when it comes to in vivo measurements, where continuous size monitoring is essential. By further improving phase sensitivity of the system, the size detection limit may be extended to below 100 nm. This dual fiber interferometer-based differential PGC technique for size detection may find many applications in biosensors and microfluidic biomedical chips, due to the stability, capacity of resisting disturbance, and easy integration with this fiber system. Real-time measurement of particle size allows for fast classification, filtering, or transportation of rare cells in the sample analysis without sampling or pretreatment. Further work is under way to develop detection systems with noise suppression using digital filtering and a phase sensitive amplifier to enhance sensitivity for a large dynamic range.