
Rui Yang, Zhenfa Xue, Zhiyong Shi, Liqiang Zhou, Linwei Zhu. Scalable Talbot effect of periodic array objects[J]. Chinese Optics Letters, 2020, 18(3): 030501
- Chinese Optics Letters
- Vol. 18, Issue 3, 030501 (2020)
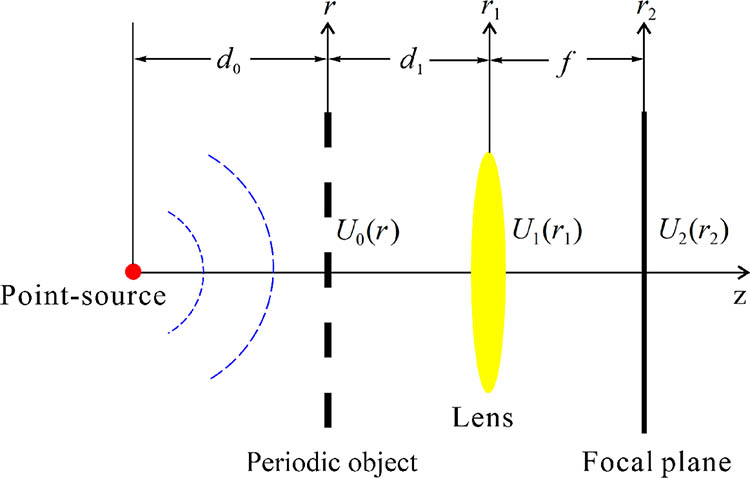
Fig. 1. Schematic of the scalable Talbot effect in the focal plane of a lens.
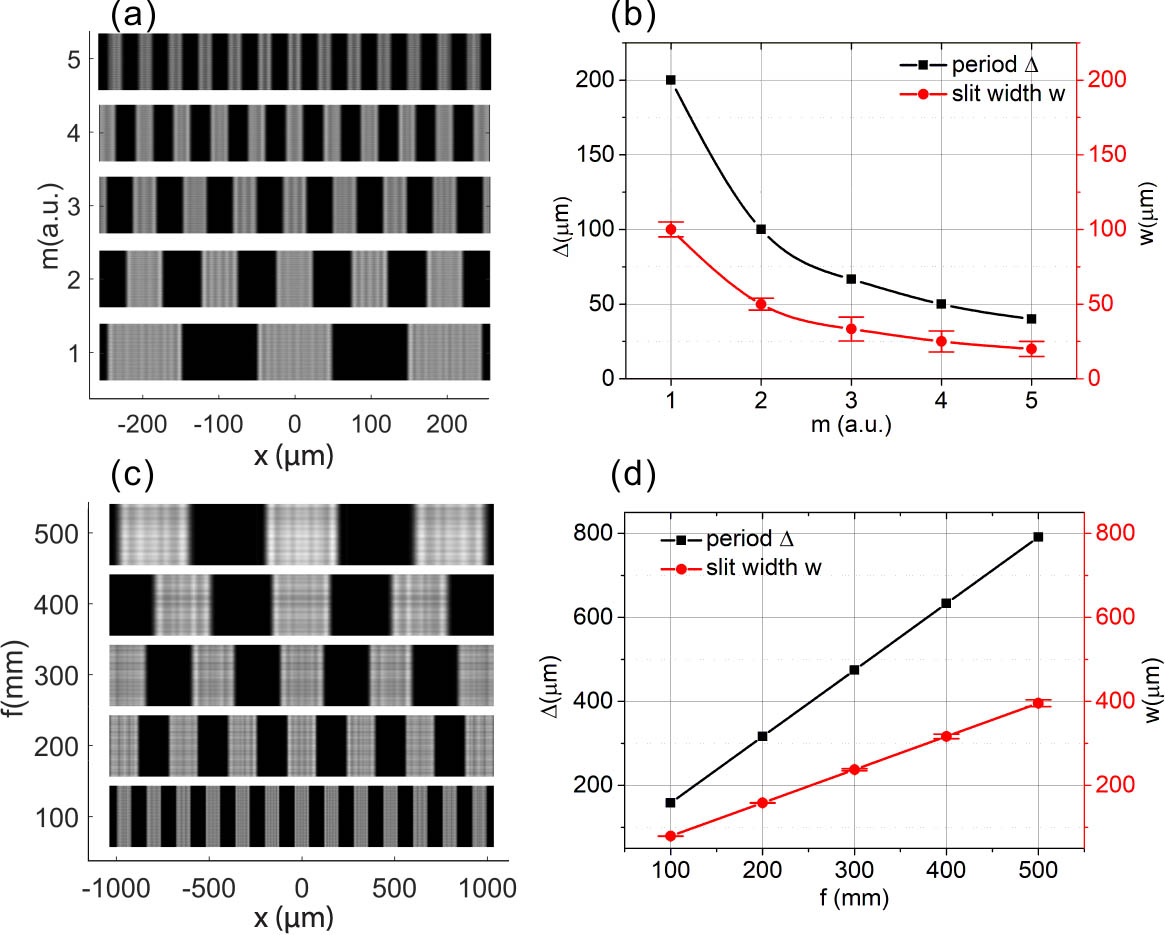
Fig. 2. Simulated diffraction patterns in the focal plane. (a) The intensity distribution of the grating with different
Fig. 3. Schematic diagram of the experimental setup.
Fig. 4. Experimental results recorded by the CCD with (a) various distances
Fig. 5. (a) and (b) are the corresponding 1D curves of the centerlines shown in Figure 4 . (c) and (d) are the period and slit-width as a function of the distance parameter
Fig. 6. Experimental results recorded by the CCD with a hexagonal array object with period

Set citation alerts for the article
Please enter your email address
© Copyright 2018-2021 | Chinese Laser Press. All Rights Reserved 沪ICP备15018463号-20