- Spectroscopy and Spectral Analysis
- Vol. 42, Issue 6, 1899 (2022)
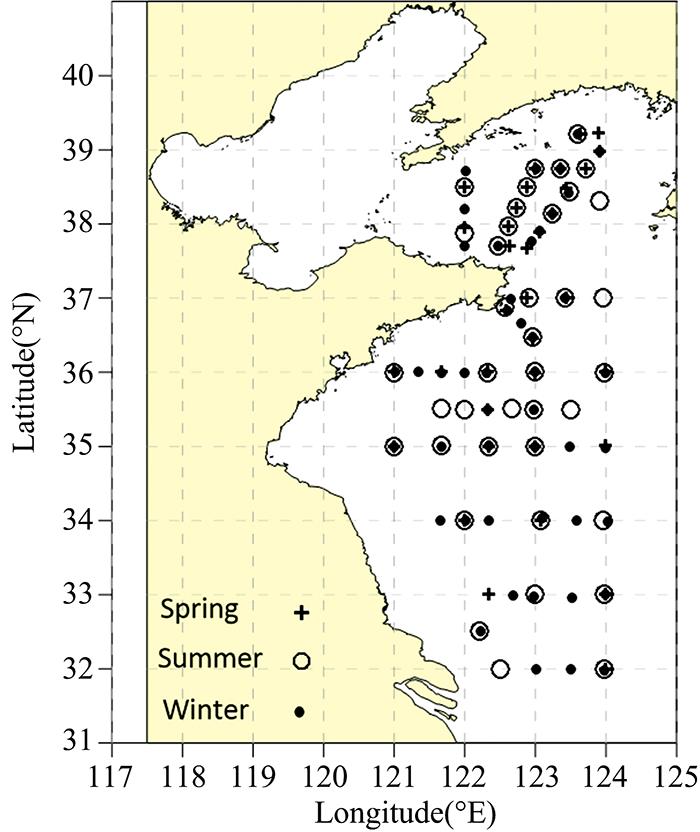
Fig. 1. The distribution of survey station in the Yellow sea
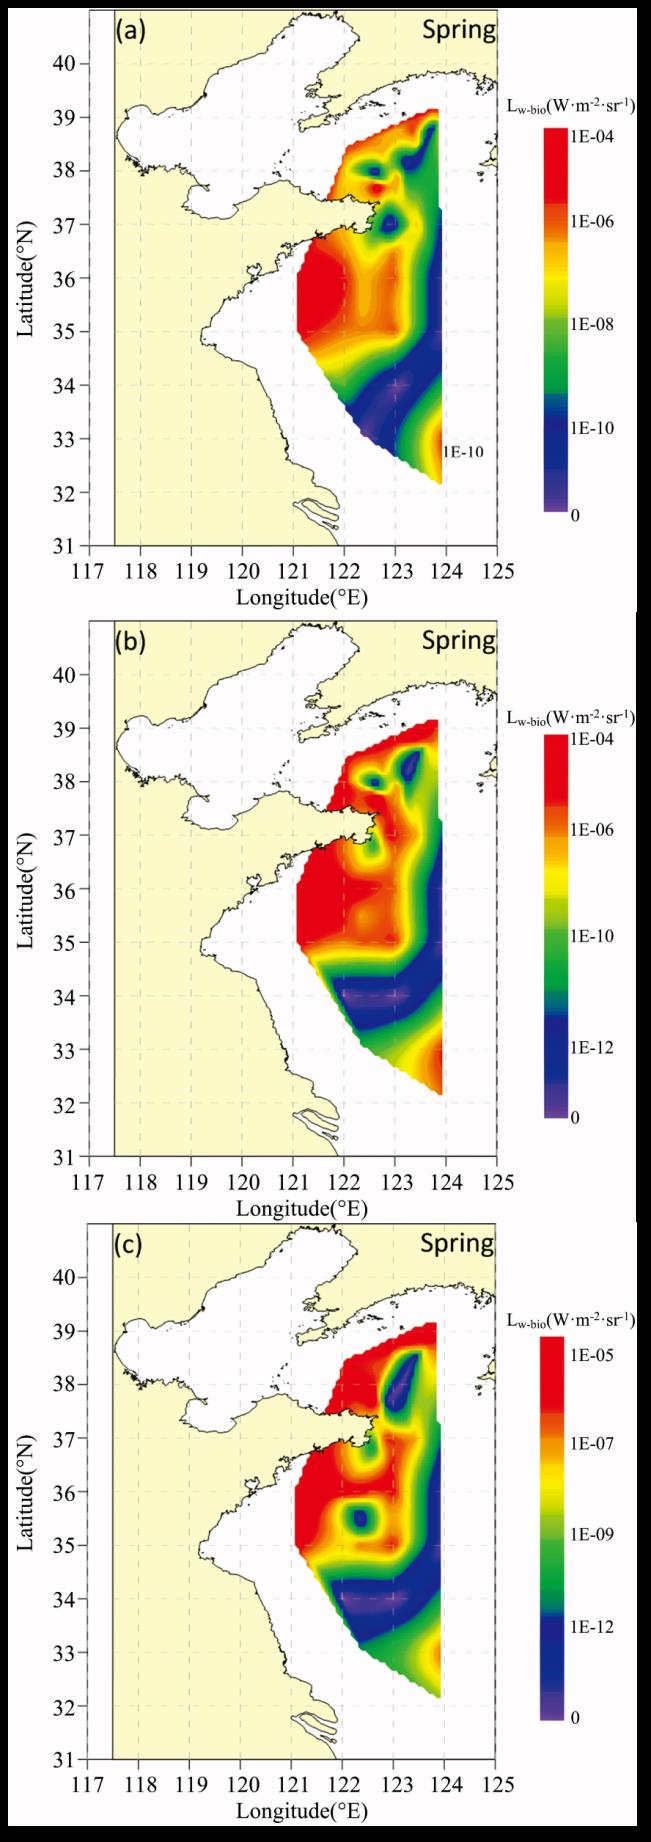
Fig. 2. The spatial distribution of L w-bio at bioluminescence source depths of 4 m (a), 8 m (b) and 15 m (c) in the Yellow Sea during spring
Fig. 3. The spatial distribution of L w-bio at bioluminescence source depths of 4 m (a), 8 m (b) and 15 m (c) in the Yellow Sea during summer
Fig. 4. The spatial distribution of L w-bio at bioluminescence source depths of 4 m (a), 8 m (b) and 15 m (c) in the Yellow Sea during winter
Fig. 5. The spectrum of L w-bio at different depths in the Yellow Sea (Different curves represent different depths)
Fig. 6. The variation of geometric depth d , Δλ and maximum L w-bio
the black line represents the average ofτ
the black line represents the average of
Fig. 7. The variation of optical depth τ , Δλ and maximum L w-bio
the black line represents the average ofd
the black line represents the average of
Fig. 8. The fitting result of geometric depth d with Δλ and maximum L w-bio
Fig. 9. The fitting result of optical depth τ with Δλ and maximum L w-bio
Fig. 10. The retrieval result of geometric depth (the straight line represents 1:1 line)
Fig. 11. The error statistics of retrieval result of geometric depth (Errors=actual value-predicted value)
|
Table 1. Main input settings of Hydrolight
| ||||||||||||||||||||||||||||||||||||||||||||||||||||||||||
Table 2. The value of L w-bio at different depths of bioluminescence source in different seasons
| ||||||||||||||||||||||||||||||||||||||||
Table 3. The value of MBP at different depths of bioluminescence source in different seasons

Download Citation

Set citation alerts for the article
Please enter your email address
© Copyright 2018-2021 | Chinese Laser Press. All Rights Reserved 沪ICP备15018463号-20