
Lingyi Zhao, Ruiqin Yang, Weiping Cai. Application of Surface-Enhanced Raman Spectroscopy in the Detection of Classical Opioids[J]. Laser & Optoelectronics Progress, 2022, 59(17): 1700002
- Laser & Optoelectronics Progress
- Vol. 59, Issue 17, 1700002 (2022)
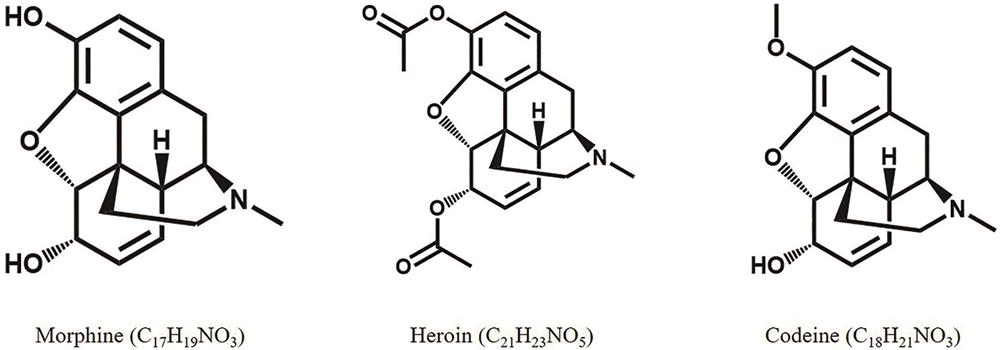
Fig. 1. Molecular structures of morphine, heroin, and codeine
![Experimental results. (a) Process of rapid detecting morphine in urine by LLME-SERS; (b) Raman spectra of morphine with different mass concentrations in urine[36]](/richHtml/lop/2022/59/17/1700002/img_02.jpg)
Fig. 2. Experimental results. (a) Process of rapid detecting morphine in urine by LLME-SERS; (b) Raman spectra of morphine with different mass concentrations in urine[36]
Fig. 3. SERS spectra of morphine illegally added in chafing dish[43]
Fig. 4. Experimental results. (a) Schematic diagram of morphine analysis based on immunochromatography-SERS; (b) relationship curve between B/B0 value and morphine mass concentration (B/B0: intensity of peak at 1078 cm-1 of the sample solution/the intensity of the peak at 1078 cm-1 of the blank solution. Inset: corresponding immunochromatographic detection assay stripes); (c) specificity of morphine detected by ICA-SERS[44]
Fig. 5. Experimental results. (a) SERS spectrum obtained after wiping the surface containing 5 μg of heroin and performing lateral flow concentration; (b) heroin mass concentration curve obtained by measuring the peak intensity at 626 cm-1 (inset: peak intensity at the low nanogram levels); SERS spectra of heroin and IR780 dye (c) before and (d) after chromatographic separation[48-49]
Fig. 6. Experimental results. (a) Schematic diagram of NaCl crystal-induced SERS platform and the distribution of effective laser spots; (b) SERS spectra of heroin with different mass concentrations collected at of 2 μm from the edge of NaCl crystal[50]
Fig. 7. Experimental results. (a) Photograph of the glass fiber sheet before (top) and after (bottom) loading Au nanoparticles, and a simple sampling rod (middle); (b) SERS spectra of codeine at 50, 25, 10, 5, 1, 0.5, 0.25, and 0.1 μg/mL; (c) photograph of the SERS flow-separation strip; SERS spectra of different mass concentrations of codeine in (d) saliva, (e) plasma, and (f) whole blood[55-56]
|
Table 1. Characteristics of three methods for detecting morphine in complex matrices
| |||||||||||||||||||||||||||||||||||||||||||||||||||||||||||||||||||||||||||||||||||||||||||||||||||||||||
Table 2. Summary of research on the detection of classical opioids based on SERS in recent years

Set citation alerts for the article
Please enter your email address
© Copyright 2018-2021 | Chinese Laser Press. All Rights Reserved 沪ICP备15018463号-20