
Qin CHENG, Yong YANG, Lili YANG. Pt-Au Dendritic Nanoparticles with High Oxidase-like Activity for Detection of Ascorbic Acid [J]. Journal of Inorganic Materials, 2020, 35(10): 1169
- Journal of Inorganic Materials
- Vol. 35, Issue 10, 1169 (2020)
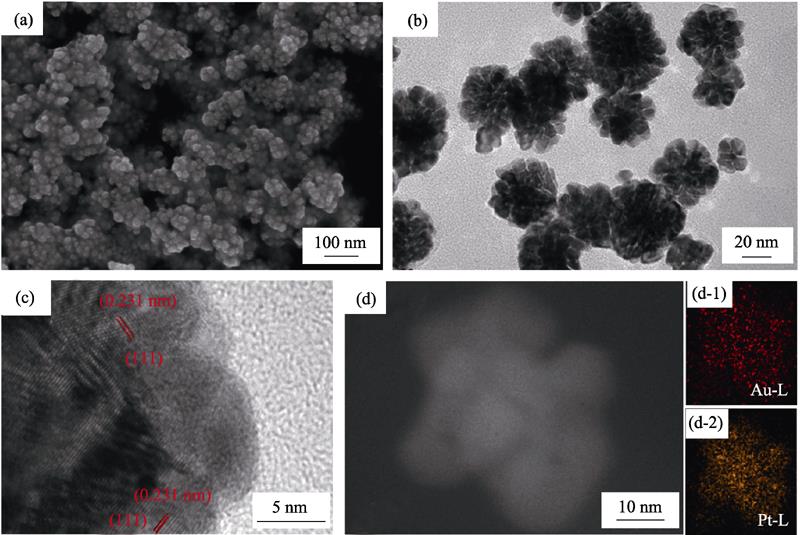
1. (a) SEM and (b) TEM images of the as-synthesized Pt-Au DNPs (after 20 min reaction); (c) HRTEM image, (d) STEM image and EDS mapping for Au, Pt elements distribution of one single Pt-Au nanoparticle (d-1: Au and d-2:Pt)
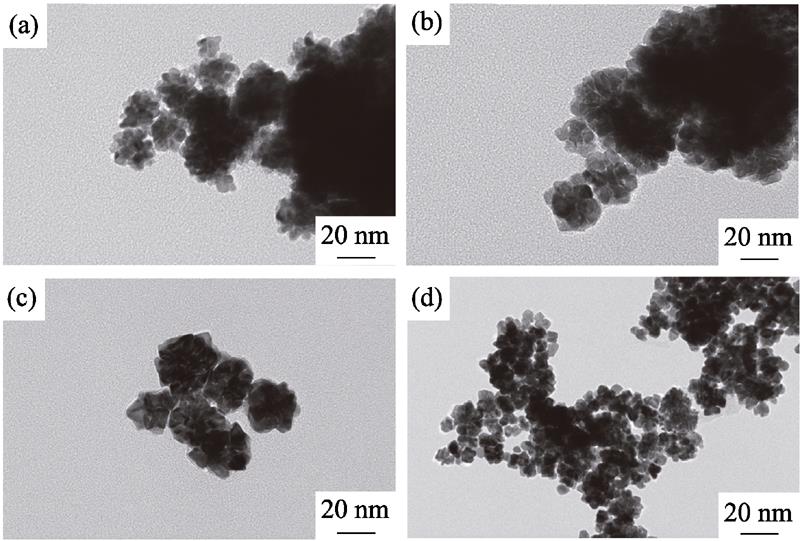
2. TEM images of Pt-Au DNPs prepared for at (a) 5, (b) 10, (c) 20, and (d) 40 min
3. TEM images of Pt-Au DNPs obtained by adding different concentrations of HCl (a) 0wt%; (b) 18.5wt%; (c) 37%wt%
4. TEM images of Pt-Au DNPs obtained with different concentrations of PVP (a) 0.0187 mol/L; (b) 0.0375 mol/L; (c) 0.0750 mol/L
5. UV-visible absorption spectra of different systems
6. Effects of different experimental conditions on the oxidase-like activity of Pt-Au DNPs. The Absorbance spectra and visual color changes of TMB in presence of different (a) Pt-Au DNPs concentration, (b) pH, (c) time, (d) temperature, respectively, with insets showing the corresponding photos of the reaction solutions
7. (a) Michaelis-Menten curve and (b) Lineweaver-Burk plots of Pt-Au DNPs with TMB concentration ([TMB])
8. Time-dependent absorbance for (a) Pt-Au DNPs catalyzed TMB oxidation in the presence of different concentrations of AA and (b) ox-TMB reduced by AA
9. (a) Dose-response curve for different concentrations of AA standard solutions, with inset showing the linear calibration plot for AA, and (b) interference of different interfering substances in the AA detection, all interfering substances were at a concentration of 25 μmol/L
S1. EDS elemental analysis of Pt-Au DNPs
S2. XRD pattern Pt-Au DNPs
S3. Color change of the solution with different concentration of HCl after reaction for 5 min
S4. FT-IR spectra of Pt-Au DNPs
S5. TMB oxidation catalyzed by different NPs
S6. TMB oxidation catalyzed by Pt-Au NPs with different Au/Pt ratio
S7. Effect of preparation conditions on values of Michaelis constant for TMB oxidation
S8. (a) Pt-Au DNPs continuously catalyzed the oxidation of TMB (each time incubation for 10 min after reducing ox-TMB by AA, with the fourth time showing the result of centrifugal washing of Pt-Au DNPs before incubation), and (b) linear calibration curve for AA after 20 min of TMB second oxidation
S9. Evolutions of the absorption of AA at 264 nm over time with and without Pt-Au DNPs
S10. Linear calibration plot for AA of Pt-Au NPs
|
Table 1.
Detection of AA in real juice sample
|
Table 2.
Comparative table of steady-state kinetic parameter for Pt-Au DNPs and other materials
|
Table 3.
Comparison of earlier reports for the AA detection.

Set citation alerts for the article
Please enter your email address
© Copyright 2018-2021 | Chinese Laser Press. All Rights Reserved 沪ICP备15018463号-20