• Journal of Geographical Sciences
  • Vol. 30, Issue 1, 85 (2020)
Qihui CHEN1、1、1, Hua CHEN1、1、1、1、1、1、*, Jun ZHANG1、1、1, Yukun HOU1、1、1, Mingxi SHEN1、1、1, Jie CHEN1、1、1, and Chongyu XU1、1、1、1、1、1
Author Affiliations
  • 11State Key Laboratory of Water Resources and Hydropower Engineering, Wuhan University, Wuhan 430072, China
  • 12Hydrology Bureau of Yangtze River Water Conservancy Commission, Wuhan 430015, China
  • 13Department of Geosciences, University of Oslo, Norway
  • show less
    DOI: 10.1007/s11442-020-1716-9 Cite this Article
    Qihui CHEN, Hua CHEN, Jun ZHANG, Yukun HOU, Mingxi SHEN, Jie CHEN, Chongyu XU. Impacts of climate change and LULC change on runoff in the Jinsha River Basin[J]. Journal of Geographical Sciences, 2020, 30(1): 85 Copy Citation Text show less
    Map of the Jinsha River Basin showing the location of weather stations, hydrological stations, reaches, sub-regions, and DEM
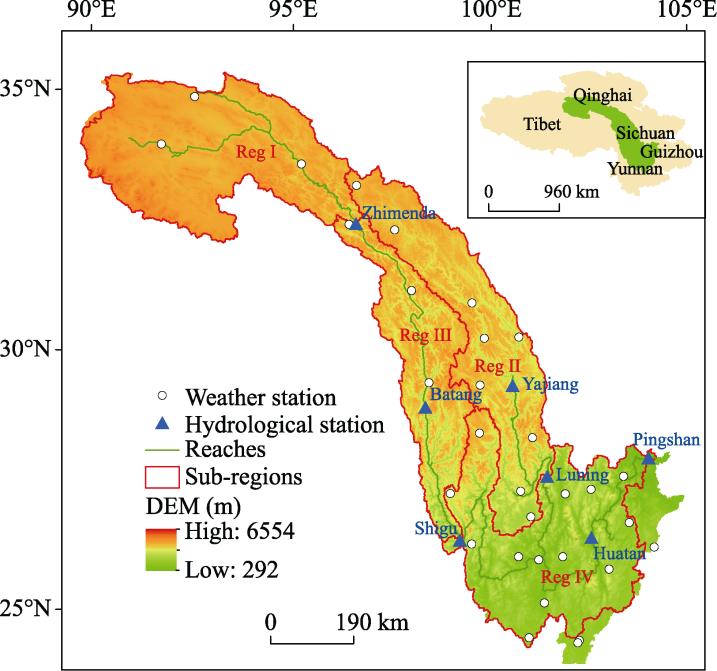
    Fig. 1. Map of the Jinsha River Basin showing the location of weather stations, hydrological stations, reaches, sub-regions, and DEM
    The changes in extreme precipitation frequency N and flood season precipitation ratio R during 1960-2016(Note: In this research the daily precipitation greater than 50 mm is defined as an extreme precipitation event, and the flood season is set to be June to September.)
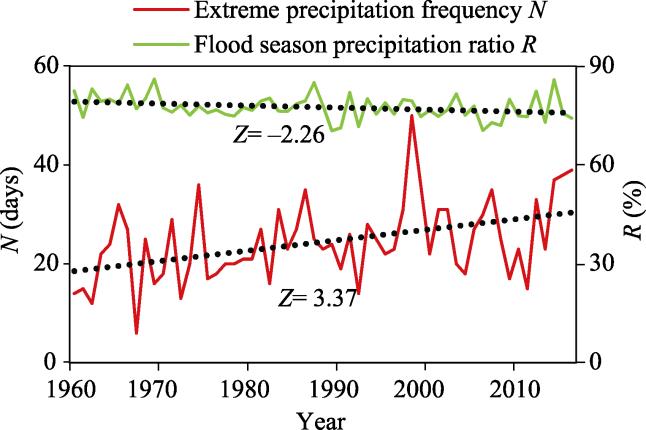
    Fig. 2. The changes in extreme precipitation frequency N and flood season precipitation ratio R during 1960-2016(Note: In this research the daily precipitation greater than 50 mm is defined as an extreme precipitation event, and the flood season is set to be June to September.)
    Changes of observed annual average runoff and the trend analysis results at Pingshan hydrological station from 1960 to 2016
    Fig. 3. Changes of observed annual average runoff and the trend analysis results at Pingshan hydrological station from 1960 to 2016
    Annual average land use distribution in various regions of the Jinsha River Basin during 1980-2015
    Fig. 4. Annual average land use distribution in various regions of the Jinsha River Basin during 1980-2015
    Runoff simulation effects of Pingshan hydrological station in the verification period (2000-2016)
    Fig. 5. Runoff simulation effects of Pingshan hydrological station in the verification period (2000-2016)
    Simulation results of the 16 different climate and land use scenarios in the outlets of various regions in the Jinsha River Basin
    Fig. 6. Simulation results of the 16 different climate and land use scenarios in the outlets of various regions in the Jinsha River Basin
    Selection procedures of typical GCMs under RCP4.5 emission scenario
    Fig. 7. Selection procedures of typical GCMs under RCP4.5 emission scenario
    The predicted change rates of annual average precipitation compared with the historical period (a) and the Mann-Kendall test results of the annual average precipitation (b) predicted by the 7 typical GCMs in various regions of the Jinsha River Basin
    Fig. 8. The predicted change rates of annual average precipitation compared with the historical period (a) and the Mann-Kendall test results of the annual average precipitation (b) predicted by the 7 typical GCMs in various regions of the Jinsha River Basin
    Change rates (the predicted averaged values compared with that of historical period) and the Mann-Kendall test results of annual extreme precipitation frequency N in 2017-2050
    Fig. 9. Change rates (the predicted averaged values compared with that of historical period) and the Mann-Kendall test results of annual extreme precipitation frequency N in 2017-2050
    The predicted change values and the Mann-Kendall test results of annual average temperature (Tmax and Tmin) in 2017-2050 in the Jinsha River Basin under different representative climate and emission scenarios
    Fig. 10. The predicted change values and the Mann-Kendall test results of annual average temperature (Tmax and Tmin) in 2017-2050 in the Jinsha River Basin under different representative climate and emission scenarios
    Change rates of annual average runoff (2017-2050) compared with the historical period (1960-2016) (a) and the Mann-Kendall test results of annual average runoff in 2017-2050 (b) predicted by the 7 typical GCMs in various regions of the Jinsha River Basin
    Fig. 11. Change rates of annual average runoff (2017-2050) compared with the historical period (1960-2016) (a) and the Mann-Kendall test results of annual average runoff in 2017-2050 (b) predicted by the 7 typical GCMs in various regions of the Jinsha River Basin
    Statistical results of predicted flood season discharge ratio f at Pingshan hydrological station, including Mann-Kendall test Z statistics and the change rates of f compared with the historical period
    Fig. 12. Statistical results of predicted flood season discharge ratio f at Pingshan hydrological station, including Mann-Kendall test Z statistics and the change rates of f compared with the historical period
    Changes of predicted annual average precipitation, temperature and runoff compared with the historical period (1960-2016) in the whole Jinsha River Basin
    Fig. 13. Changes of predicted annual average precipitation, temperature and runoff compared with the historical period (1960-2016) in the whole Jinsha River Basin
    Extreme precipitation frequency NHistorical periodRCP4.5RCP8.5
    CCSM4MPIMRICCSM4IPSLMIROCMRI
    Variation coefficient Cv0.330.420.550.400.510.620.540.46
    Table 1.

    1 Variation coefficient (Cv) of extreme precipitation frequency N under different typical climate and emission scenarios during 2017-2050, together with that of historical period (1960-2016)

    Data typeDescriptionData source
    DEM dataSpatial resolution of 200 mGeospatial Data Cloud
    Soil dataSpatial resolution of 1000 mFood and Agriculture Organization of the United Nations (FAO)
    Land use dataIn year 1980, 1990, 2000, 2010, 2015 with spatial resolution of 1000 mNational Earth System Science Data Sharing Infrastructure
    Climate dataDaily data from 31 weather stations, including precipitation, temperature, wind speed, solar radiation, humidity and evaporation (1960-2016)China Meteorological Data Service Center (CMDC)
    Hydrological dataMonthly runoff data from 7 hydrological stations (1960-2016)Yangtze River Water Conservancy Commission
    Table 1.

    Description of research data used in this research

    Typical GCMsCold-dryCold-wetWarm-dryWarm-wet
    RCP4.5MRI-CGCM3CCSM4MPI-ESM-LRCCSM4
    RCP8.5MRI-CGCM3CCSM4IPSL-CM5A-MRMIROC-ESM
    Table 1.

    0 Typical GCMs selected under RCP4.5 and RCP8.5 emission scenarios, the outputs of each typical GCM respectively representing the typical climate scenarios of cold-dry, cold-wet, warm-dry and warm-wet in 2017-2050

    PeriodsP1P2P3P4
    Climate data1977-19861987-19961997-20062007-2016
    Land use dataLU1980LU1990LU2000LU2010
    Table 2.

    Research periods and the corresponding climate and land use data

    ScenariosClimate dataLand use dataScenariosClimate dataLand use data
    S11977-1986LU1980S91997-2006LU1980
    S21977-1986LU1990S101997-2006LU1990
    S31977-1986LU2000S111997-2006LU2000
    S41977-1986LU2010S121997-2006LU2010
    S51987-1996LU1980S132007-2016LU1980
    S61987-1996LU1990S142007-2016LU1990
    S71987-1996LU2000S152007-2016LU2000
    S81987-1996LU2010S162007-2016LU2010
    Table 3.

    Sixteen simulation scenarios combining historical measured climate and land use data in different periods

    PeriodsAnnual average precipitation (mm)
    Reg IReg IIReg IIIReg IVBasin
    P1 (1977-1986)321.5682.9556.6875.3604.9
    P2 (1987-1996)310.5704.9600.7862.7610.5
    P3 (1997-2006)345.3711.0622.3930.7645.7
    P4 (2007-2016)392.2701.0572.9843.6624.7
    Historical (1960-2016)338.7691.4583.6873.6616.2
    Z values in M-K test2.071.630.760.592.07
    Table 4.

    Annual average precipitation in different periods calculated by Thiessen polygon method and the trend analysis results of historical precipitation (1960-2016) in various regions of the Jinsha River Basin

    Temperature (℃)P1P2P3P41960-2016Z values
    Reg ITmax4.04.95.25.64.75.1
    Tmin-10.7-10.3-9.6-8.6-10.05.8
    Reg IITmax13.513.814.315.014.04.6
    Tmin-1.1-0.4-0.10.5-0.67.6
    Reg IIITmax16.016.016.417.116.33.7
    Tmin1.01.41.92.41.38.0
    Reg IVTmax20.320.320.921.420.63.5
    Tmin8.58.89.39.78.96.8
    BasinTmax12.913.313.714.313.44.7
    Tmin-1.0-0.5-0.00.6-0.57.4
    Table 5.

    Annual average maximum and minimum temperature (Tmax and Tmin) in different periods and the trend analysis results (Z values) in various regions of the Jinsha River Basin

    Hydrological stationsZhimendaYajiangLuningBatangShiguHuatanPingshan
    Z values in M-K test1.200.60.430.830.400.260.12
    Table 6.

    Mann-Kendall test results of historical observed annual average runoff (1960-2016) in the seven hydrological stations in the Jinsha River Basin

    Statistics (1960-2016)Characteristic variables
    Runoff coefficient (r)Extreme flood frequency D (days)Flood season discharge ratio f (%)
    Mean0.50241.362.1
    Z values in M-K test-1.930.647-1.74
    Table 7.

    Statistical results of three characteristic values of runoff (Runoff coefficient r, Extreme flood frequency D and flood season discharge ratio f) at Pingshan hydrological station during the period of 1960-2016

    Land useMean annual area (103 km2)Area ratio (%)Change rates (%)
    1980-19901990-20002000-20102010-2015
    Grassland234.352.530.170.10-0.09-0.10
    Forest land132.429.68-0.24-0.260.12-0.09
    Bare land41.99.40-0.100.22-0.01-0.02
    Farmland26.45.92-0.26-0.30-1.94-0.89
    Wetland6.91.550.38-0.600.55-0.59
    Water body3.50.78-0.613.080.599.38
    Building land0.60.145.958.99140.4636.01
    Table 8.

    Annual mean distribution and the change rates of various land use in adjacent periods during the past 35 years (1980-2015) in the Jinsha River Basin

    Hydrological stationsRiver systemCalibration period (1970-1999)Verification period (2000-2016)
    NSPBIAS (%)NSPBIAS (%)
    ZhimendaTongtian River0.847.40.800.8
    YajiangYalong River0.812.00.7213.4
    LuningYalong River0.864.80.7715.9
    BatangJinsha River0.87-0.20.89-1.0
    ShiguJinsha River0.8914.40.916.7
    HuatanJinsha River0.93-13.70.90-5.8
    PingshanJinsha River0.93-6.50.90-5.4
    Absolute average mean0.887.00.847.0
    Table 9.

    Calibration and verification results in the seven hydrological stations in the Jinsha River Basin in SWAT model, with the evaluation indicators being Nash-Sutcliff coefficient (NS) and the Percent Bias (PBIAS)

    Qihui CHEN, Hua CHEN, Jun ZHANG, Yukun HOU, Mingxi SHEN, Jie CHEN, Chongyu XU. Impacts of climate change and LULC change on runoff in the Jinsha River Basin[J]. Journal of Geographical Sciences, 2020, 30(1): 85
    Download Citation