• Journal of Geographical Sciences
  • Vol. 30, Issue 1, 85 (2020)
Qihui CHEN1、1、1, Hua CHEN1、1、1、1、1、1、*, Jun ZHANG1、1、1, Yukun HOU1、1、1, Mingxi SHEN1、1、1, Jie CHEN1、1、1, and Chongyu XU1、1、1、1、1、1
Author Affiliations
  • 11State Key Laboratory of Water Resources and Hydropower Engineering, Wuhan University, Wuhan 430072, China
  • 12Hydrology Bureau of Yangtze River Water Conservancy Commission, Wuhan 430015, China
  • 13Department of Geosciences, University of Oslo, Norway
  • show less
    DOI: 10.1007/s11442-020-1716-9 Cite this Article
    Qihui CHEN, Hua CHEN, Jun ZHANG, Yukun HOU, Mingxi SHEN, Jie CHEN, Chongyu XU. Impacts of climate change and LULC change on runoff in the Jinsha River Basin[J]. Journal of Geographical Sciences, 2020, 30(1): 85 Copy Citation Text show less

    Abstract

    The climate change and Land Use/Land Cover (LULC) change both have an important impact on the rainfall-runoff processes. How to quantitatively distinguish and predict the impacts of the above two factors has been a hot spot and frontier issue in the field of hydrology and water resources. In this research, the SWAT (Soil and Water Assessment Tool) model was established for the Jinsha River Basin, and the method of scenarios simulation was used to study the runoff response to climate change and LULC change. Furthermore, the climate variables exported from 7 typical General Circulation Models (GCMs) under RCP4.5 and RCP8.5 emission scenarios were bias corrected and input into the SWAT model to predict runoff in 2017-2050. Results showed that: (1) During the past 57 years, the annual average precipitation and temperature in the Jinsha River Basin both increased significantly while the rising trend of runoff was far from obvious. (2) Compared with the significant increase of temperature in the Jinsha River Basin, the LULC change was very small. (3) During the historical period, the LULC change had little effect on the hydrological processes in the basin, and climate change was one of the main factors affecting runoff. (4) In the context of global climate change, the precipitation, temperature and runoff in the Jinsha River Basin will rise in 2017-2050 compared with the historical period. This study provides significant references to the planning and management of large-scale hydroelectric bases at the source of the Yangtze River.

    In recent years, the problem of water resources under changing environment has become a research focus. Being important parts of environmental changes, the Land Use/Land Cover (LULC) change and climate change have significant impacts on the hydrological cycle through changing processes such as precipitation, evapotranspiration and infiltration, thus affecting the rainfall-runoff processes (Liu et al., 2008; Yin et al., 2017) and the amount of available water resources (Li et al., 2012; Luo et al., 2011). Therefore, the study of runoff response to LULC change and climate change is of great importance in water resources planning and management (Chen et al., 2018; Li et al., 2009, 2018; Liu et al., 2014; Pan et al., 2017; Yang et al., 2018; Yin et al., 2017; Zhang et al., 2012).

    Many researchers have studied the runoff response to climate change and LULC change, which is generally done by the following three kinds of methods. The first one is the Comparison of Basin Experiment, which is an effective approach and very suitable for studies in small watersheds to eliminate the influence of climate change (Gao and Ruan, 2018). The second one is the Statistical Method based on the analysis of hydrometerological data series (Gao et al., 2015; Pan et al., 2018; Piao et al., 2010). It is a pure mathematical tool without considering the spatial heterogeneity and mechanisms of LULC change and climate change on hydrological processes, although with relatively simple operation. The third one is the Model Simulations using distributed hydrological models, which has been widely used (Guo et al., 2012, 2014; Lu et al., 2016; Yuan et al., 2015; Zhao et al., 2012), especially in recent years, with the rapid development and application of Remote Sensing technology. Compared with the first two methods, the Model Simulation Method not only takes the spatial heterogeneity into consideration, but it also possesses the advantage of a better description of hydro-physical processes (Mu et al., 2004). The general ideas are firstly to build the hydrological model, and then to perform scenarios simulation based on the combination of various land use and climate scenarios. After obtaining the simulated runoff, the impacts of different land use types or climate scenarios on the basin runoff can be quantitatively analyzed.

    Although plenty of researches have been done in this field (Li et al., 2009; Liu et al., 2014; Wang et al., 2017b; Zhang et al., 2012), the conclusions of hydrological response to LULC change and climate change in different watersheds fail to reach an agreement (Luo et al., 2011; Ozturk et al., 2013; Wang et al., 2017a; Yuan et al., 2015), indicating deficient knowledges regarding the deep mechanisms. Besides, some existing researches on the hydrological response mainly focus on the change of single environmental factor, either LULC (Ozturk et al., 2013; Wang et al., 2017a, 2017b) or climate (Piao et al., 2010). Among study cases in China, the research areas are mostly concentrated in the Yellow River (Hao et al., 2010; Liu et al., 2003; Zhang et al., 2014), the middle and lower reaches of the Yangtze River (Li et al., 2005; Yuan et al., 2015), etc. However, little work has been done in the Jinsha River Basin (Du et al., 2013; Liu et al., 2017), which is the source of the Yangtze River, with extremely complicated topography and significant climate variation, whose sustainable utilization of water resources is of critical importance to the strategy of Western Development in China. Therefore more work is needed in the Jinsha River Basin.

    In the background of global climate change, the Jinsha River Basin is becoming warmer and wetter (Song et al., 2012; Wang and Zhang, 2012; Xia et al., 2008; Zhuo et al., 2011). Moreover, with the development of Western China, the industrialization processes accelerated significantly, resulting in obvious changes in the area of building land and water body. Two objectives are to be achieved in this research. Firstly, to quantitatively distinguish the impacts of climate change and LULC change on runoff during the historical period, and then to predict the runoff changes under changing environment during the period of 2017-2050 in the Jinsha River Basin. To accomplish that, the historical measured data of precipitation, temperature, evaporation, runoff and land use during the past few decades in the Jinsha River Basin were analyzed, and the SWAT (Soil and Water Assessment Tool) model (Arnold et al., 1998; Awan et al., 2016; Singh et al., 2015) was established to quantitatively analyze the runoff response to LULC change and climate change. On this basis, the General Circulation Models (GCMs) were adopted to predict runoff in 2017-2050 under representative climate and emission scenarios.

    2 Study area and data

    2.1 Study area

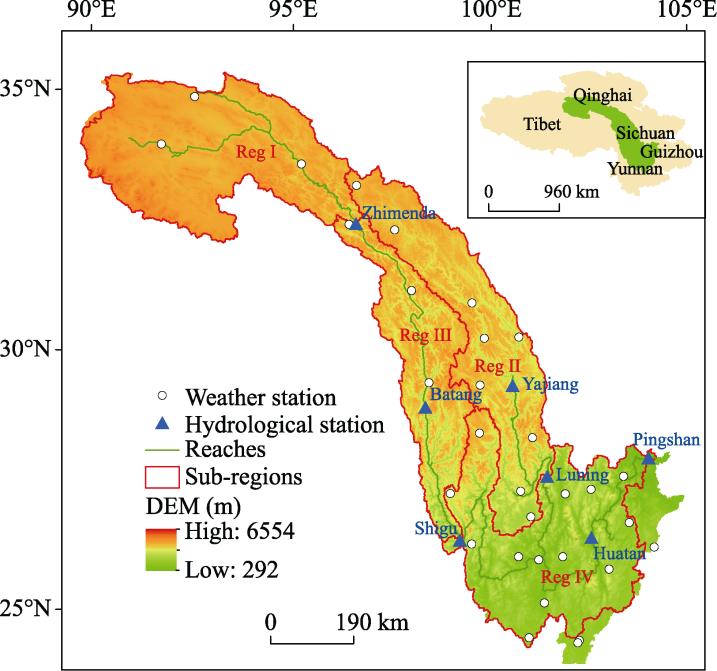
    The Jinsha River Basin is located in the upper reaches of the Yangtze River, with an area of 45.5×10⁴ km2. The annual average precipita-tion, runoff and temperature are respectively 614 mm, 310.7 mm and 5.8 ℃. Besides, the annual precipitation and runoff are mainly concentrated in June to September. According to the role and charac-teristics of land, the land use in the Jinsha River Basin was divided into seven categories: grassland, forest land, bare land, farmland, wetland, water body and building land.Among them the area of grassland is the largest (52%), followed by forest land (30%), and the building land area is the smallest.

    Map of the Jinsha River Basin showing the location of weather stations, hydrological stations, reaches, sub-regions, and DEM

    Figure 1. Map of the Jinsha River Basin showing the location of weather stations, hydrological stations, reaches, sub-regions, and DEM

    Referring to the results of watershed delineation in SWAT model, the Jinsha River Basin was divided into four regions (I, II, III, IV), with the controlling outlets being Zhimenda, Luning, Shigu and Pingshan hydrological stations consecutively. The characteristics of each region were separately summarized.

    2.2 Data

    A wide variety of data are needed in this study, including Digital Elevation Model (DEM) data, soil data, land use data and meteorological data, etc. (Table 1). In addition, two physical characteristic databases of the study area need to be built: soil database and meteorological database.

    Extreme precipitation frequency NHistorical periodRCP4.5RCP8.5
    CCSM4MPIMRICCSM4IPSLMIROCMRI
    Variation coefficient Cv0.330.420.550.400.510.620.540.46

    Table 1.

    1 Variation coefficient (Cv) of extreme precipitation frequency N under different typical climate and emission scenarios during 2017-2050, together with that of historical period (1960-2016)

    In this study, totally 28 GCMs from phase 5 of the Coupled Model Intercomparison Project (Taylor et al., 2012) were employed to predict climate data in 2017-2050. Under RCP4.5 and RCP8.5 emission scenarios (Taylor et al., 2012; Vuuren et al., 2011), the GCM outputs of precipitation and temperature in 31 weather stations in the Jinsha River Basin were extracted, and the error correction was carried out using Daily Bias Correction (DBC) method. Four typical GCMs were selected for each emission scenario, respectively representing typical climate scenarios of warm-dry, warm-wet, cold-dry and cold-wet. And the typical climate data, together with the observed land use data in 2015 were incorporated into SWAT model to predict runoff in 2017-2050.

    3 Methodology

    3.1 SWAT model

    SWAT model has got the ability to simulate and predict the long-term changes of various hydrological elements under different land use types, soil types and management practices on the large scale complex basin (Abbaspour et al., 2007; da Silva et al., 2018; Gassman et al., 2007; Li et al., 2018; Liang et al., 2017). In SWAT model, runoff is firstly calculated for each Hydrological Response Unit (HRU) and then routed to obtain total runoff for the watershed. This increases accuracy and gives a much better physical description of the water balance. In this research, the Runoff Curve Number Method and Muskingum Method were respectively employed for the calculation of runoff generation and flow concentration, and the snowmelt was calculated using Degree Daily Factor Method with the glacier snowmelt being one of the main runoff sources in the upper reaches of the Jinsha River Basin (Yang et al., 2012).

    3.2 Mann-Kendall trend test

    As a non-parametric test method, the Mann-Kendall method is widely used in the trend analysis of hydrological series with a remarkable advantage of simple operation (Mann, 1945; Kendall, 1975; Yue et al., 2002a, 2002b; Hamed, 2008). It does not require samples to follow certain distributions and the analysis results are not interfered by a few abnormal values. In this research the 95% confidence level was adopted to evaluate the variation trend of the sequence, with the threshold of the standard normal statistics Z equals to 1.96.

    3.3 Scenarios simulation

    In this study, the periods 1977-1986, 1987-1996, 1997-2006, and 2007-2016 are defined as P1, P2, P3 and P4 respectively. The corresponding land use data in each period are LU1980, LU1990, LU2000 and LU2010 respectively.

    PeriodsP1P2P3P4
    Climate data1977-19861987-19961997-20062007-2016
    Land use dataLU1980LU1990LU2000LU2010

    Table 2.

    Research periods and the corresponding climate and land use data

    In order to explore the runoff response of LULC change and climate change over the past 40 years, 16 scenarios were set up in this study. They are the combination of historical measured climate and land use data (Table 3). Through comparison of simulation results between scenarios, the effects of the two environmental factors (climate change and LULC change) on runoff in different periods can be quantitatively analyzed.

    ScenariosClimate dataLand use dataScenariosClimate dataLand use data
    S11977-1986LU1980S91997-2006LU1980
    S21977-1986LU1990S101997-2006LU1990
    S31977-1986LU2000S111997-2006LU2000
    S41977-1986LU2010S121997-2006LU2010
    S51987-1996LU1980S132007-2016LU1980
    S61987-1996LU1990S142007-2016LU1990
    S71987-1996LU2000S152007-2016LU2000
    S81987-1996LU2010S162007-2016LU2010

    Table 3.

    Sixteen simulation scenarios combining historical measured climate and land use data in different periods

    3.4 Daily Bias Correction method

    In this study, the climate data under RCP4.5 and RCP8.5 emission scenarios in 2017-2050 was predicted by GCMs, and then corrected using Daily Bias Correction (DBC) method, which is a hybrid method combining Local Intensity Scaling method (LOCI) and Daily Transformation method (DT) (Chen et al., 2011, 2013). Firstly, the LOCI method is used to correct the precipitation frequency, and then the empirical distribution of daily precipitation and temperature is calibrated using DT method.

    4 Results and discussion

    4.1 Trend analysis of historical data

    4.1.1 Hydro-meteorological elements

    The annual average precipitation, temperature and runoff in the historical period (1960-2016) were analyzed using Thiessen polygon method and Mann-Kendall trend test method in this part. Table 4 lists the annual average precipitation and the M-K test results in various regions of the basin. The precipitation varied greatly in different regions, and it continued to rise from P1 to P3, and then declined from P3 to P4. In all regions of the basin there existed rising trends (Z>0), which were obvious in region I and the whole basin at 95% confidence level (Z>1.96). Overall, there was a relatively obvious rising trend in precipitation during the past 57 years in the Jinsha River Basin.

    PeriodsAnnual average precipitation (mm)
    Reg IReg IIReg IIIReg IVBasin
    P1 (1977-1986)321.5682.9556.6875.3604.9
    P2 (1987-1996)310.5704.9600.7862.7610.5
    P3 (1997-2006)345.3711.0622.3930.7645.7
    P4 (2007-2016)392.2701.0572.9843.6624.7
    Historical (1960-2016)338.7691.4583.6873.6616.2
    Z values in M-K test2.071.630.760.592.07

    Table 4.

    Annual average precipitation in different periods calculated by Thiessen polygon method and the trend analysis results of historical precipitation (1960-2016) in various regions of the Jinsha River Basin

    The annual extreme precipitation frequency N and precipitation ratio in flood season R in the Jinsha River Basin were separately calculated during 1960-2016 (Figure 2). The variation trends were analyzed by M-K test method with Z values respectively calculated to be 3.37 and -2.26, indicating a significant rising trend of N and decreasing trend of R (|Z|>1.96), which implied the rising risks of flood disaster and a more uniform annual distribution of precipitation in the basin.

    The changes in extreme precipitation frequency N and flood season precipitation ratio R during 1960-2016(Note: In this research the daily precipitation greater than 50 mm is defined as an extreme precipitation event, and the flood season is set to be June to September.)

    Figure 2. The changes in extreme precipitation frequency <italic>N</italic> and flood season precipitation ratio <italic>R</italic> during 1960-2016(Note: In this research the daily precipitation greater than 50 mm is defined as an extreme precipitation event, and the flood season is set to be June to September.)

    The annual average maximum and minimum temperatures (Tmax and Tmin) in the Jinsha River Basin in various periods are shown in Table 5. Seen from the spatial scale, the differences among regions were significant, with the temperature rising consecutively from region I to region IV. And on the temporal scale, the Tmax and Tmin in all regions increased from period P1 to P4. The Mann-Kendall test results in 1960-2016 showed that the standard normal statistics Z were greater than 2.58, indicating obvious rising trends at 99% confidence level. And the rising trend of Tmin was more obvious than that of Tmax (by comparing Z values).

    Temperature (℃)P1P2P3P41960-2016Z values
    Reg ITmax4.04.95.25.64.75.1
    Tmin-10.7-10.3-9.6-8.6-10.05.8
    Reg IITmax13.513.814.315.014.04.6
    Tmin-1.1-0.4-0.10.5-0.67.6
    Reg IIITmax16.016.016.417.116.33.7
    Tmin1.01.41.92.41.38.0
    Reg IVTmax20.320.320.921.420.63.5
    Tmin8.58.89.39.78.96.8
    BasinTmax12.913.313.714.313.44.7
    Tmin-1.0-0.5-0.00.6-0.57.4

    Table 5.

    Annual average maximum and minimum temperature (Tmax and Tmin) in different periods and the trend analysis results (Z values) in various regions of the Jinsha River Basin

    The M-K test results of annual average runoff during 1960-2016 in the Jinsha River Basin are shown in Table 6, with locations of hydrological stations shown in Figure 1. In the historical period the runoff at all 7 hydrological stations showed upward trend, which was not significant (1.96>Z>0). Meanwhile, the runoff at Pingshan hydrological station, the outlet of Jinsha River Basin, has decreased significantly since 1998 (Figure 3). Three physical characteristic variables related to basin runoff were statistically analyzed (Table 7). They are the runoff coefficient r, the annual extreme flood frequency D and the flood season discharge ratio f. The mean values of r, D and f in the past 57 years were respectively 0.502, 41.3 and 62.1%, and the corresponding Z values in M-K test were -1.93, 0.647 and -1.74, indicating relatively significant declining trend of r at 95% confidence level (close to -1.96), while D and f had no obvious trend.

    Changes of observed annual average runoff and the trend analysis results at Pingshan hydrological station from 1960 to 2016

    Figure 3. Changes of observed annual average runoff and the trend analysis results at Pingshan hydrological station from 1960 to 2016

    Hydrological stationsZhimendaYajiangLuningBatangShiguHuatanPingshan
    Z values in M-K test1.200.60.430.830.400.260.12

    Table 6.

    Mann-Kendall test results of historical observed annual average runoff (1960-2016) in the seven hydrological stations in the Jinsha River Basin

    Statistics (1960-2016)Characteristic variables
    Runoff coefficient (r)Extreme flood frequency D (days)Flood season discharge ratio f (%)
    Mean0.50241.362.1
    Z values in M-K test-1.930.647-1.74

    Table 7.

    Statistical results of three characteristic values of runoff (Runoff coefficient r, Extreme flood frequency D and flood season discharge ratio f) at Pingshan hydrological station during the period of 1960-2016

    4.1.2 Land use

    The land use changes in the Jinsha River Basin during the period of 1980-2015 are shown in Table 8. The major land use types are grassland, followed by forest land and bare land. During the past 35 years, the areas of grassland, forest land, bare land and wetland generally remained unchanged, while the farmland continued to shrink at relatively low rates. Affected by the construction of various water conservancy projects, the water bodies in the basin continued to grow since 1990s with the fastest pace occurring in 2010-2015. In addition, with the development of social economy, the area of building land has risen continuously especially since 21th century. In conclusion, during the historical period, the areas of building land and water body in the Jinsha River Basin have changed greatly. However, they occupy a very small proportion of area in the basin.

    Land useMean annual area (103 km2)Area ratio (%)Change rates (%)
    1980-19901990-20002000-20102010-2015
    Grassland234.352.530.170.10-0.09-0.10
    Forest land132.429.68-0.24-0.260.12-0.09
    Bare land41.99.40-0.100.22-0.01-0.02
    Farmland26.45.92-0.26-0.30-1.94-0.89
    Wetland6.91.550.38-0.600.55-0.59
    Water body3.50.78-0.613.080.599.38
    Building land0.60.145.958.99140.4636.01

    Table 8.

    Annual mean distribution and the change rates of various land use in adjacent periods during the past 35 years (1980-2015) in the Jinsha River Basin

    In general, during the past 35 years the LULC change was very small on the temporal scale, while on the spatial scale the land use distribution varied significantly across regions (Figure 4). It can be seen from Figure 4 that: (1) From region I to region IV, the area of grassland gradually decreased while the forest land increased. (2) In region I there was almost no building land, farmland, and forest land. Meanwhile, the grassland and bare land were widely distributed. (3) The main land-use types in regions II and III were grassland and forest land, and the distribution of bare land was also extensive. (4) The main land-use types in region IV were forest land, grassland and farmland, respectively accounting for 53.4%, 29.4% and 15.7% of the total area, while the remaining 4 land use types were very sparsely distributed.

    Annual average land use distribution in various regions of the Jinsha River Basin during 1980-2015

    Figure 4. Annual average land use distribution in various regions of the Jinsha River Basin during 1980-2015

    4.2 Modeling results and analysis

    4.2.1 Calibration and verification

    The SUFI-2 algorithm in SWAT-CUP (Abbaspour et al., 2007) was adopted for the calibration and verification of SWAT model with the periods set to be respectively 1970-1999 and 2000-2016. The Nash-Sutcliff coefficient (NS) as well as the Percent Bias (PBIAS) were selected as evaluation indicators (Table 9). The average values of NS and PBIAS in the 7 hydrological stations during the calibration and verification period were respectively 0.88, 7% and 0.84, 7%, indicating good simulation performance of SWAT model in the Jinsha River Basin. The simulated runoff well matched the observed ones in Zhimenda, Batang, Pingshan, Shigu and Huatan hydrological stations, while the simulation effects of Yajiang and Luning hydrological stations were barely satisfactory reflected by the lower peaks and higher valleys. In this study, even though the method of partition calibration was adopted to deal with the spatial heterogeneity of the basin, it was still hard to achieve satisfactory simulation performance for all hydrological stations because of the large area and complicated topography of the basin, together with the impacts of complex human activities. Figure 5 presents the comparison between simulated and observed monthly runoff at Pingshan hydrological station during the verification period.

    Hydrological stationsRiver systemCalibration period (1970-1999)Verification period (2000-2016)
    NSPBIAS (%)NSPBIAS (%)
    ZhimendaTongtian River0.847.40.800.8
    YajiangYalong River0.812.00.7213.4
    LuningYalong River0.864.80.7715.9
    BatangJinsha River0.87-0.20.89-1.0
    ShiguJinsha River0.8914.40.916.7
    HuatanJinsha River0.93-13.70.90-5.8
    PingshanJinsha River0.93-6.50.90-5.4
    Absolute average mean0.887.00.847.0

    Table 9.

    Calibration and verification results in the seven hydrological stations in the Jinsha River Basin in SWAT model, with the evaluation indicators being Nash-Sutcliff coefficient (NS) and the Percent Bias (PBIAS)

    Runoff simulation effects of Pingshan hydrological station in the verification period (2000-2016)

    Figure 5. Runoff simulation effects of Pingshan hydrological station in the verification period (2000-2016)

    4.2.2 Attribution analysis and discussion

    The calibrated SWAT model is used for runoff simulation under different climate and land use scenarios. In this research the historical climate and land use data of the P1-P4 periods were mutually combined, forming 16 different scenarios (Table 3), which were input into SWAT model to obtain simulated runoff (Figure 6). For all regions of the basin, when the climate data input into the SWAT model were fixed, few differences existed in the simulated runoff with different land use data (by comparing scenarios S1-S4, S5-S8, S9-S12 and S13-S16). Therefore, the effects of LULC change on runoff were very small. However, when the land use data remained unchanged, the simulated runoff changed greatly with the variation of climate data, accordingly the climate change is the main driving force of runoff change during the historical period.

    Simulation results of the 16 different climate and land use scenarios in the outlets of various regions in the Jinsha River Basin

    Figure 6. Simulation results of the 16 different climate and land use scenarios in the outlets of various regions in the Jinsha River Basin

    Selection procedures of typical GCMs under RCP4.5 emission scenario

    Figure 7. Selection procedures of typical GCMs under RCP4.5 emission scenario

    The results so far indicated that the climate change is the dominant factor influencing runoff, while the LULC change has little effects. Therefore, in the latter part of the study the main focus was drawn on the runoff response in the context of climate change.

    4.3 Prediction of precipitation, temperature and runoff in 2017-2050

    4.3.1 Selection of typical GCMs

    In this research the typical GCMs were selected based on 10% and 90% quantiles of the change in precipitation ΔP (%) and temperature ΔT (℃) in the predicted period compared with the reference period (Immerzeel et al., 2013). Taking the selection of typical GCMs under RCP4.5 emission scenario as an example (Figure 7), the blue points stand for the corrected output of GCMs. The 10% and 90% quantiles of ΔP and ΔT were calculated separately, forming four vertices shown in the red dots. They represented the ideal warm-dry, warm-wet, cold-dry and cold- wet climate scenarios in 2017-2050. The specific GCMs closest to the four vertices were selected as the representative GCMs, as shown in the green triangular points.

    Table Infomation Is Not Enable

    4.3.2 Precipitation and temperature prediction

    During the period of 2017-2050, the changes of annual average precipitation and temperature compared with the historical period (1960-2016) were statistically analyzed and the trend analysis was conducted.

    The change rates and M-K test results of predicted precipitation in various regions of the basin are displayed in Figure 8. The precipitation predicted by all typical GCMs in region II, III and the whole basin shows an upward trend (Z>0) and is larger than that observed in the historical period. For region I, almost all typical GCMs forecast increased values and rising trends of precipitation, except for MPI under RCP4.5, and the change rates vary greatly with the highest being 25.95% while the lowest being only -0.24%. In region IV, significant variations exist in the precipitation change rates, with 3 typical GCMs forecasting decreases while the other forecasting increases. Besides, only one typical GCM forecasted an insignificant decreasing trend in precipitation (MRI under RCP4.5) while the other predicted increasing trends. Therefore, conclusions can be drawn that compared with the historical period (1960-2016), the precipitation in regions I, II, III and the whole basin will rise with a large probability in the next 34 years, while large uncertainties exist in the precipitation change in region IV. And under the two emission scenarios the predicted precipitation in all regions will considerably show rising trends. Furthermore, under RCP4.5 emission scenario the trends are generally insignificant, while the significance level varies a lot under RCP8.5.

    The predicted change rates of annual average precipitation compared with the historical period (a) and the Mann-Kendall test results of the annual average precipitation (b) predicted by the 7 typical GCMs in various regions of the Jinsha River Basin

    Figure 8. The predicted change rates of annual average precipitation compared with the historical period (a) and the Mann-Kendall test results of the annual average precipitation (b) predicted by the 7 typical GCMs in various regions of the Jinsha River Basin

    The annual extreme precipitation frequency N was statistically analyzed (Figure 9 and Table 11). The values of N exhibit increasing trends for all typical GCMs, which are not sta-tistically significant (0<Z<1.96) (Figure 9), indicating insignificant rising trends of extreme precipitation frequency during the period of 2017-2050. In addition, the change rates of N fluctuate between positive and negative, which implies uncertainties of the changing direction. Meanwhile, for all typical GCMs the predicted variation coefficient Cv increases obviously compared with the historical period (Table 11). Accordingly, it can be concluded that the extreme precipitation frequency in the basin will exhibit a rising trend with a large probability, and a more uneven inter-annual distribution of extreme precipitation events will be noticed in 2017-2050.

    Change rates (the predicted averaged values compared with that of historical period) and the Mann-Kendall test results of annual extreme precipitation frequency N in 2017-2050

    Figure 9. Change rates (the predicted averaged values compared with that of historical period) and the Mann-Kendall test results of annual extreme precipitation frequency <italic>N</italic> in 2017-2050

    Table Infomation Is Not Enable

    Figure 10 shows the trend analysis results of predicted temperature (2017-2050) and the change values compared with the historical period (1960-2016). Both Tmax and Tmin will increase in 2017-2050, with the magnitudes being 0.57-2.05℃ and 1.24-2.05℃ respectively. Besides, the temperature increase in RCP8.5 emission scenario is greater than that of RCP4.5 when the typical climate scenarios are fixed. The Mann-Kendall trend test was conducted for the predicted Tmax and Tmin in 2017-2050, and the results showed that in the next 34 years, the temperature predicted by all GCMs will exhibit a significant increasing trend (Z>1.96). Furthermore, the trend of Tmin will be more remarkable than that of Tmax.

    The predicted change values and the Mann-Kendall test results of annual average temperature (Tmax and Tmin) in 2017-2050 in the Jinsha River Basin under different representative climate and emission scenarios

    Figure 10. The predicted change values and the Mann-Kendall test results of annual average temperature (<italic>T</italic><sub>max</sub> and <italic>T</italic><sub>min</sub>) in 2017-2050 in the Jinsha River Basin under different representative climate and emission scenarios

    4.3.3 Runoff prediction

    The climate data predicted by the typical GCMs were separately input into the SWAT model, together with the measured land use data in 2015, to predict the runoff at the 7 hydrological stations (Figure 1) during the period of 2017-2050.

    The runoff change rates predicted by all typical GCMs were summerized at the 7 hydrological stations compared with the historical period (1960-2016) (Figure 11a). For all typical GCMs, the predicted annual average runoff at Huatan and Pingshan hydrological stations increases in comparison with the historical period, with the growth rates fluctuating among 4.8%-19.5% and 0.4%-14.7%, respectively. In addition, compared with the other four hydrological stations, the variations of runoff change rates in Zhimenda, Batang and Shigu hydrological stations are larger. Especially for Zhimenda hydrological station, which is located in the upper reaches of the Jinsha River, the change rates vary between -6.4% and 50.4%. It may be attributed to the complex topography of the controlling area as well as the sophisticated sources of runoff (both snowmelt and precipitation), which lead to large uncertainties. In conclusion, there exist obvious spatial variabilities in the runoff changes in the Jinsha River Basin. And the runoff in Zhimenda, Batang and Shigu hydrological stations, which are located in the upper reaches of the Jinsha River, possesses larger uncertainties compared with Yalong River and the lower reaches of the Jinsha River in 2017-2050. However, compared with the historical period, the runoff near the basin outlet (Pingshan and Huatan hydrological station) will increase with a large probability.

    Change rates of annual average runoff (2017-2050) compared with the historical period (1960-2016) (a) and the Mann-Kendall test results of annual average runoff in 2017-2050 (b) predicted by the 7 typical GCMs in various regions of the Jinsha River Basin

    Figure 11. Change rates of annual average runoff (2017-2050) compared with the historical period (1960-2016) (a) and the Mann-Kendall test results of annual average runoff in 2017-2050 (b) predicted by the 7 typical GCMs in various regions of the Jinsha River Basin

    The M-K trend test was conducted for the predicted annual runoff in the 7 hydrological stations. Only a few typical GCMs forecast decreasing trends of runoff (insignificant) in some specific hydrological stations during the period of 2017-2050, while the remaining predicted runoff exhibits a rising trend (Z>0) (Figure 11b). In addition, the predicted runoff under RCP8.5 emission scenario tends to present more obvious rising trends compared with RCP4.5. Furthermore, there is almost no obvious trend in predicted runoff under RCP4.5 emission scenario, while under RCP8.5, the runoff at Huatan and Pingshan hydrological stations, which are closest to the basin outlet, shows significant rising trends (Z>1.96) for all typical GCMs.

    Statistical results of predicted flood season discharge ratio f at Pingshan hydrological station, including Mann-Kendall test Z statistics and the change rates of f compared with the historical period

    Figure 12. Statistical results of predicted flood season discharge ratio <italic>f</italic> at Pingshan hydrological station, including Mann-Kendall test <italic>Z</italic> statistics and the change rates of <italic>f</italic> compared with the historical period

    The average ratio of flood season discharge f in the historical period (1960-2016) was calculated to be 0.621. All the values of f predicted by the 7 typical GCMs in 2017-2050 are slightly lower than that of historical period, with the declining rates ranging between -5.01% and -8.12% (Figure 12). Besides, the decreasing rates under RCP8.5 emission scenario are much higher than that of RCP4.5. Meanwhile, the Mann-Kendall trend test method was used to analyze the trend of f, and the results showed that no obvious trend exists in the next 34 years (|Z| < 1.96). Therefore, there will be no obvious trend of flood season discharge ratio in the next 34 years. However, the f values will decrease slightly (within 10%) compared with the historical period, indicating a more even annual distribution of runoff.

    Changes of predicted annual average precipitation, temperature and runoff compared with the historical period (1960-2016) in the whole Jinsha River Basin

    Figure 13. Changes of predicted annual average precipitation, temperature and runoff compared with the historical period (1960-2016) in the whole Jinsha River Basin

    To sum up, during the period of 2017- 2050, the annual average precipitation, temperature and runoff in the Jinsha River Basin predicted by the 7 typical GCMs will be larger than that of historical period (1960-2016), with the increasing magnitudes being 0.40%- 9.26% (equivalent to an increase of 2.5-57.1 cm), 0.91- 2.05℃, and 0.36%-14.66% (equivalent to an increase of 16-659 m3/s) respectively (Figure 13).

    5 Conclusions

    In this study, the historical changes of climate, land use and runoff in the Jinsha River Basin were statistically analyzed, and a distributed hydrological model (SWAT) was set up. The attribution analysis of runoff change in the historical period was conducted through simulation results of 16 scenarios combining historical measured climate and land use data. Seven typical GCMs under RCP4.5 and RCP8.5 emission scenarios were selected to predict the precipitation and temperature in 2017-2050. After bias correction, the climate scenarios were input into the SWAT model to predict runoff in 2017-2050. Conclusions are drawn as follows:

    (1) During the past 57 years, the measured precipitation and temperature in the Jinsha River Basin showed a significant rising trend at 95% confidence level, while the rising trend of runoff was not obvious. In addition, the extreme precipitation frequency increased significantly, indicating increased flood risks in the basin.

    (2) Temperature in the Jinsha River Basin has increased significantly during the historical period, while the LULC change was very small.

    (3) In the Jinsha River Basin, the climate change is the main factor affecting runoff while the LULC change has little effect during the historical period.

    (4) The prediction of precipitation shows that compared with the historical period (1960- 2016), the annual average precipitation in the Jinsha River Basin will increase by 0.40%-9.26% (equivalent to an increase of 2.5-57.1cm) in 2017-2050. And the precipitation in regions I, II, III and the whole basin will rise with a large probability, while in region IV there exist large uncertainties. Besides, the inter-annual distribution of extreme precipitation events will be more uneven. The prediction of temperature shows that both Tmax and Tmin will increase over the next 34 years compared with the historical period, and the warming ranges are 0.57-2.05℃ and 1.24-2.05℃ respectively.

    (5) In the Jinsha River Basin, significant spatial variabilities will be noticed in runoff during the period of 2017-2050. However, the runoff change near the basin outlet will exhibit obvious regularities, which are reflected by the following three points: First, the predicted runoff near the basin outlet will increase obviously compared with the historical period, with growth rates ranging from 0.36% to 14.66% (equivalent to an increase of 16-659 m3/s). Second, under RCP8.5 emission scenario, there will be a significant upward trend in runoff in Huatan and Pingshan hydrological stations. Third, the annual distribution of the basin runoff will be more uniform compared with the historical period.

    References

    [1] C Abbaspour K, J Yang, I Maximov et al. Modelling hydrology and water quality in the pre-alpine/alpine Thur watershed using SWAT. Journal of Hydrology, 333, 413-430(2007).

    [2] G Arnold J, R Srinivasan, S Muttiah R et al. Large area hydrologic modeling and assessment (Part 1): Model development. Journal of the American Water Resources Association, 34, 73-89(1998).

    [3] K Awan U, W Liaqat U, M Choi et al. A SWAT modeling approach to assess the impact of climate change on consumptive water use in Lower Chenab Canal area of Indus basin. Hydrology Research, 47, 1025-1037(2016).

    [4] J Chen, P Brissette F, D Chaumont et al. Performance and uncertainty evaluation of empirical downscaling methods in quantifying the climate change impacts on hydrology over two North American river basins. Journal of Hydrology, 479, 200-214(2013).

    [5] J Chen, P Brissette F, R Leconte. Uncertainty of downscaling method in quantifying the impact of climate change on hydrology. Journal of Hydrology, 401, 190-202(2011).

    [6] L Chen, J Chang, Y Wang et al. Assessing runoff sensitivities to precipitation and temperature changes under global climate-change scenarios. Hydrology Research, 50, 24-42(2018).

    [7] M da Silva R, C Dantas J, A Beltrão J D et al. Hydrological simulation in a tropical humid basin in the Cerrado biome using the SWAT model. Hydrology Research, 49, 908-923(2018).

    [8] J Du, C Shi, C Zhang. Modeling and analysis of effects of precipitation and vegetation coverage on runoff and sediment yield in Jinsha River Basin. Water Science and Engineering, 6, 44-58(2013).

    [9] C Gao, T Ruan. The influence of climate change and human activities on runoff in the middle reaches of the Huaihe River Basin, China. Journal of Geographical Sciences, 28, 79-92(2018).

    [10] C Gao, Z Zhang, J Zhai et al. Research on meteorological thresholds of drought and flood disaster: A case study in the Huai River Basin, China. Stochastic Environmental Research and Risk Assessment, 29, 157-167(2015).

    [11] W Gassman P, R Reyes M, H Green C et al. The soil and water assessment tool: Historical development, applications, and future research directions. Transactions of the ASABE, 50, 1211-1250(2007).

    [12] J Guo, Z Zhang, S Wang et al. Effects of climate and land use changes on stream flow and sediment yield in Chaohe river basin. Transactions of the Chinese Society of Agricultural Engineering, 28, 236-243(2012).

    [13] J Guo, Z Zhang, S Wang et al. Appling SWAT model to explore the impact of changes in land use and climate on the streamflow in a watershed of northern China. Acta Ecologica Sinica, 34, 1559-1567(2014).

    [14] H Hamed K. Trend detection in hydrologic data: The Mann-Kendall trend test under the scaling hypothesis. Journal of Hydrology, 349, 350-363(2008).

    [15] F Hao, L Chen, C Liu et al. Impact of land use change on runoff and sediment yield. Journal of Soil Water Conservation, 18, 5-8(2010).

    [16] W Immerzeel W, F Pellicciotti, P Bierkens M F. Rising river flows throughout the twenty-first century in two Himalayan glacierized watersheds. Nature Geoscience, 6, 742-745(2013).

    [17] G Kendall M. Rank Correlation Methods. London:. Griffin.(1975).

    [18] D Li, Y Wu, C Liu. Runoff simulation with physical-based distributed hydrological model. Scientia Geographica Sinica, 25, 299-304(2005).

    [19] J Li, X Zhang, Y Yang. SWAT model of runoff study under different land use land cover scenarios in source region of the Yangtze River. Research of Soil & Water Conservation, 19, 119-129(2012).

    [20] Y Li, J Chang, L Luo et al. Spatiotemporal impacts of land use land cover changes on hydrology from the mechanism perspective using SWAT model with time-varying parameters. Hydrology Research, 50, 244-261(2018).

    [21] Z Li, W Liu, X Zhang et al. Impacts of land use change and climate variability on hydrology in an agricultural catchment on the Loess Plateau of China. Journal of Hydrology, 377, 35-42(2009).

    [22] Z Liang, T Tang, B Li et al. Long-term streamflow forecasting using SWAT through the integration of the random forests precipitation generator: Case study of Danjiangkou Reservoir. Hydrology Research, 49, 1513-1527(2017).

    [23] C Liu, D Li, Y Tian et al. An application study of DEM based distributed hydrological model on macroscale watershed. Progress in Geography, 22, 437-445(2003).

    [24] X Liu, X Li, X Shi et al. Simulating complex urban development using kernel-based non-linear cellular automata. Ecological Modelling, 211, 169-181(2008).

    [25] X Liu, D Peng, Z Xu. Identification of the impacts of climate changes and human activities on runoff in the Jinsha River Basin, China. Advances in Meteorology, 1-9(2017).

    [26] Z Liu, Z Yao, H Huang et al. Land use and climate changes and their impacts on runoff in the Yarlung Zangbo River Basin, China. Land Degradation & Development, 25, 203-215(2014).

    [27] J Lu, X Cui, X Chen et al. Evaluation of hydrological response to extreme climate variability using SWAT model: Application to the Fuhe basin of Poyang Lake Watershed, China. Hydrology Research, 48, 1730-1744(2016).

    [28] Q Luo, K Wang, Q Wang. Using SWAT to simulate runoff under different land use scenarios in Xiangjiang River Basin. Chinese Journal of Eco-Agriculture, 19, 1431-1436(2011).

    [29] B Mann H. Nonparametric tests against trend. Econometrica, 13, 245-259(1945).

    [30] X Mu, F Wang, J Li et al. Review of evaluation method of impact of soil and water conservation practices on river flows. Bulletin of Soil & Water Conservation, 73-78(2004).

    [31] M Ozturk, K Copty N, K Saysel A. Modeling the impact of land use change on the hydrology of a rural watershed. Journal of Hydrology, 497, 97-109(2013).

    [32] S Pan, D Liu, Z Wang et al. Runoff responses to climate and land use/cover changes under future scenarios. Water, 9, 475(2017).

    [33] Z Pan, X Ruan, M Qian et al. Spatio-temporal variability of streamflow in the Huaihe River Basin, China: Climate variability or human activities?. Hydrology Research, 49, 177-193(2018).

    [34] S Piao, P Ciais, Y Huang et al. The impacts of climate change on water resources and agriculture in China. Nature, 467, 43-51(2010).

    [35] V Singh H, L Kalin, A Morrison et al. Post-validation of SWAT model in a coastal watershed for predicting land use/cover change impacts. Hydrology Research, 46, 837-853(2015).

    [36] M Song, T Li, J Chen. Preliminary analysis of precipitation runoff features in the Jinsha River Basin. Procedia Engineering, 28, 688-695(2012).

    [37] E Taylor K, J Stouffer R, A Meehl G. An overview of CMIP5 and the experiment design. Bulletin of the American Meteorological Society, 93, 485-498(2012).

    [38] V Vuuren D P, J Edmonds, M Kainuma et al. The representative concentration pathways: An overview. Climatic Change, 109, 5-31(2011).

    [39] F Wang, Q Ge, Q Yu et al. Impacts of land-use and land-cover changes on river runoff in Yellow River basin for period of 1956-2012. Chinese Geographical Science, 27, 13-24(2017).

    [40] H Wang, F Sun, J Xia et al. Impact of LUCC on streamflow based on the SWAT model over the Wei River basin on the Loess Plateau in China. Hydrology and Earth System Sciences, 21, 1929-1945(2017).

    [41] S Wang, X Zhang. Long-term trend analysis for temperature in the Jinsha River Basin in China. Theoretical and Applied Climatology, 109, 591-603(2012).

    [42] J Xia, M Wang. Runoff changes and distributed hydrologic simulation in the upper reaches of Yangtze River. Resources Science, 30, 962-967(2008).

    [43] P Yang, J Xia, C Zhan et al. Separating the impacts of climate change and human activities on actual evapotranspiration in Aksu River Basin ecosystems, Northwest China. Hydrology Research, 49, 1740-1752(2018).

    [44] Y Yang, G Lu, Z Wu et al. Variation characteristics analysis of hydrological cycle factors in upper reaches of Jinshajiang Basin. Water Resources & Power, 30, 8-10(2012).

    [45] J Yin, F He, Y Xiong et al. Effects of land use/land cover and climate changes on surface runoff in a semi-humid and semi-arid transition zone in northwest China. Hydrology and Earth System Sciences, 21, 183-196(2017).

    [46] Y Yuan, Z Zhang, J Meng. Impact of changes in land use and climate on the runoff in Liuxihe Watershed based on SWAT model. Chinese Journal of Applied Ecology, 26, 989-998(2015).

    [47] S Yue, P Pilon, G Cavadias. Power of the Mann-Kendall and Spearman’s rho tests for detecting monotonic trends in hydrological series. Journal of Hydrology, 259, 254-271(2002).

    [48] S Yue, P Pilon, B Phinney et al. The influence of autocorrelation on the ability to detect trend in hydrological series. Hydrological Processes, 16, 1807-1829(2002).

    [49] A Zhang, C Zhang, G Fu et al. Assessments of impacts of climate change and human activities on runoff with SWAT for the Huifa River Basin, Northeast China. Water Resources Management, 26, 2199-2217(2012).

    [50] L Zhang, B Pang, Z Xu et al. Impacts of climate change and LUCC on hydrological processes in the Gulang River Basin. South-to-North Water Transfers and Water Science & Technology, 12, 42-46(2014).

    [51] Y Zhao, X Yu, J Zheng et al. Quantitative effects of climate variations and land-use changes on annual streamflow in Chaobai river basin. Transactions of the Chinese Society of Agricultural Engineering, 28, 252-260(2012).

    [52] G Zhuo, J Jian, Bianbaciren. Runoff of the Jinsha River: Characteristics and its response to climate change. Journal of Glaciology & Geocryology, 33, 405-415(2011).

    Qihui CHEN, Hua CHEN, Jun ZHANG, Yukun HOU, Mingxi SHEN, Jie CHEN, Chongyu XU. Impacts of climate change and LULC change on runoff in the Jinsha River Basin[J]. Journal of Geographical Sciences, 2020, 30(1): 85
    Download Citation