
Kai Zhou, Xiangjun Wang, Zhong Wang, Zijing Wan. Design and Modeling of Visual Pose Measuring System with Large Vision Range[J]. Laser & Optoelectronics Progress, 2019, 56(11): 111504
- Laser & Optoelectronics Progress
- Vol. 56, Issue 11, 111504 (2019)
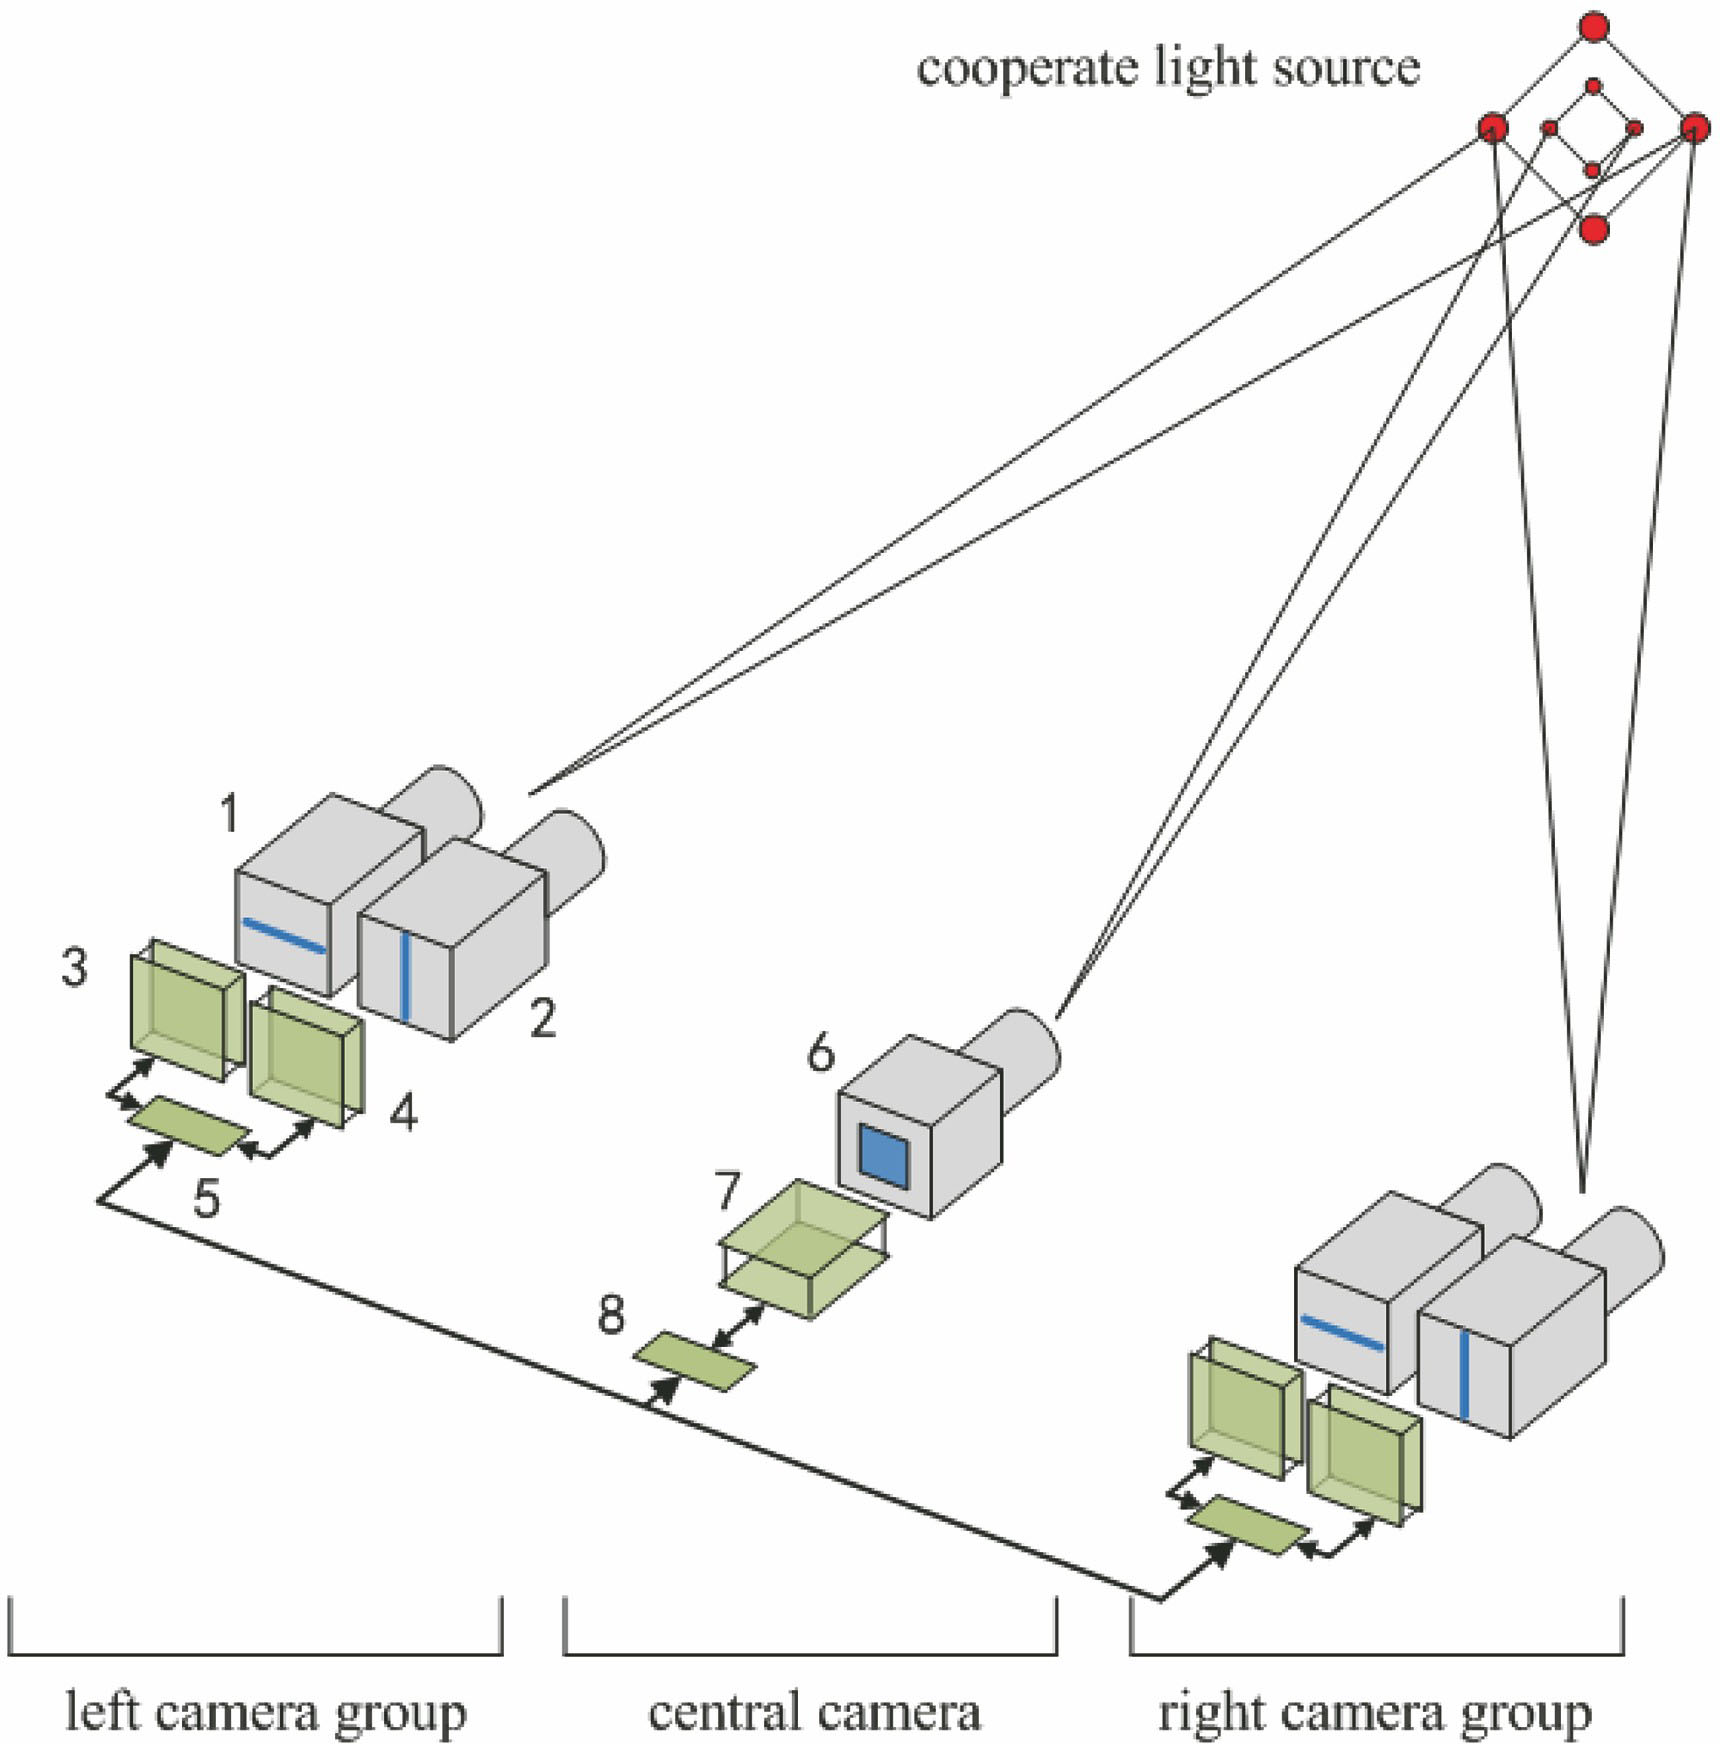
Fig. 1. Structure of system
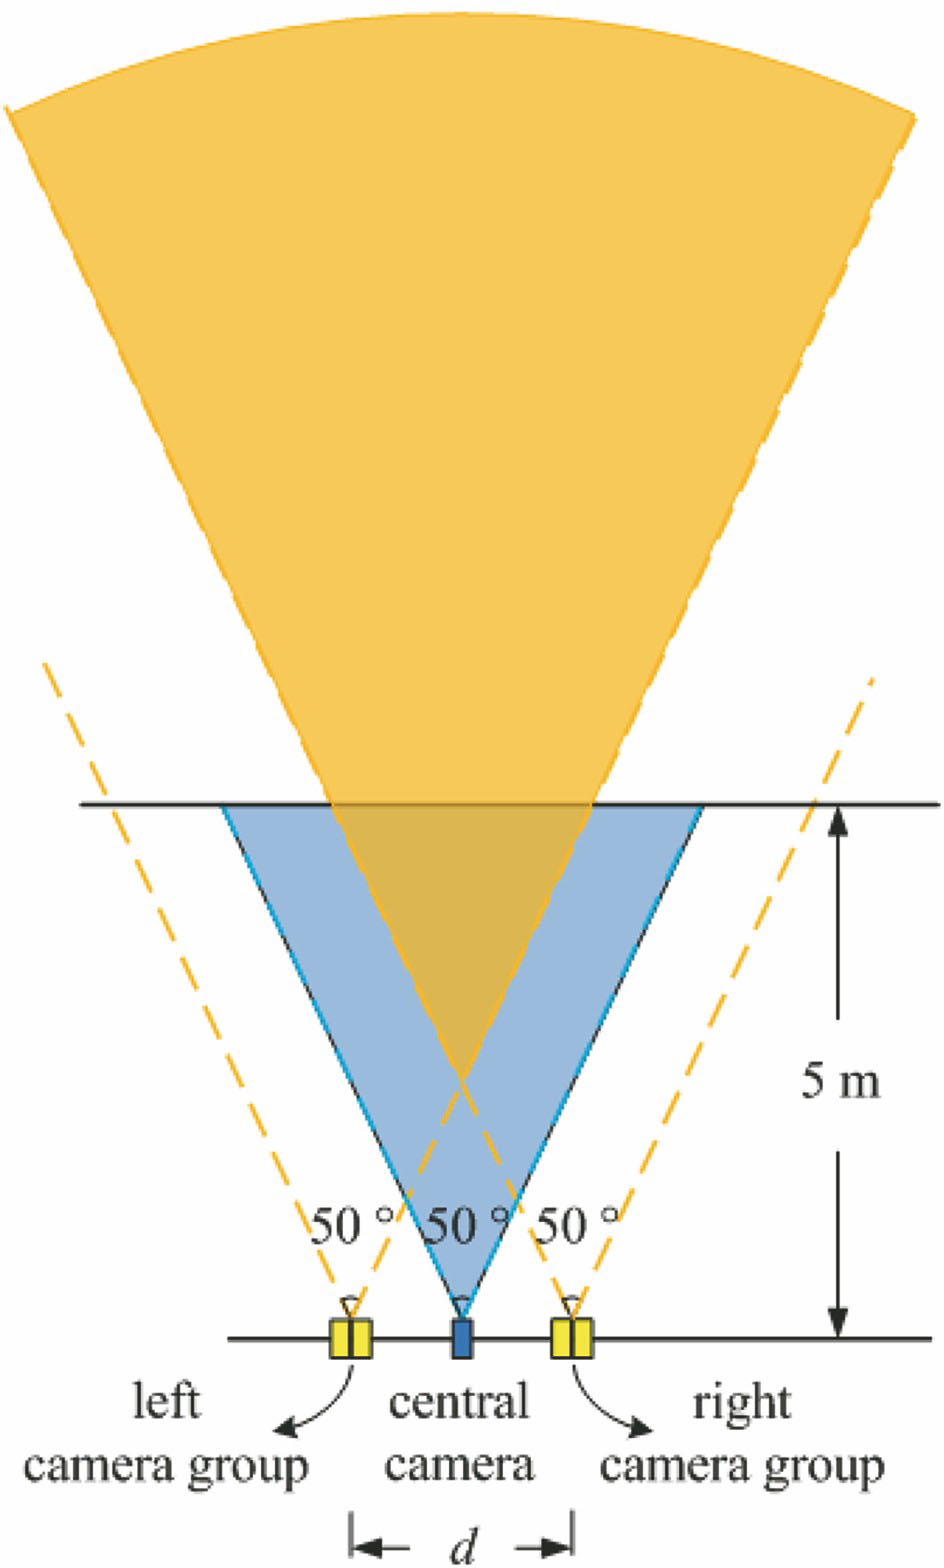
Fig. 2. Distribution of field of view
Fig. 3. Left camera group for far-segmented measurement
Fig. 4. Plane camera for near-segmented measurement
Fig. 5. Equivalent imaging model of line camera
Fig. 6. Positioning model of 4-line-camera
Fig. 7. Imaging model of plane camera for near-segmented measurement
Fig. 8. Cooperative target used in measurement experiment
Fig. 9. Segmented pose measurement system
Fig. 10. Image peaks of one outer ring LED on the four line array CCDs with vision range of 35 m. (a) Camera 1L; (b) camera 1R; (c) camera 2L; (d) camera 2R
Fig. 11. Image of inner ring LEDs on plane array camera with vision range of 5 m
Fig. 12. Distributions of calibration points and verification points in far-segmented measurement experiment
Fig. 13. Coordinate reconstruction errors of calibration points in X, Y, and Z directions
Fig. 14. Variation of attitude angle measurement result with time when target is 1 m away from camera. (a) Rolling angle; (b) pitching angle; (c) yaw angle
Fig. 15. Variation of attitude angle measurement result with time when target is 3 m away from camera. (a) Rolling angle; (b) pitching angle; (c) yaw angle
| |||||||||||||||
Table 1. Root mean square error and relative error of calibration points
| ||||||||||||||||||||||||||||||||||||||||||||||||||||||
Table 2. Measurement results of three-dimensional coordinates of random verification points

Set citation alerts for the article
Please enter your email address
© Copyright 2018-2021 | Chinese Laser Press. All Rights Reserved 沪ICP备15018463号-20