
Bingqian Zhou, Jingjing Guo, Changxi Yang, Lingjie Kong, "Upconversion-luminescent hydrogel optical probe for in situ dopamine monitoring," Photonics Res. 8, 1800 (2020)
- Photonics Research
- Vol. 8, Issue 11, 1800 (2020)
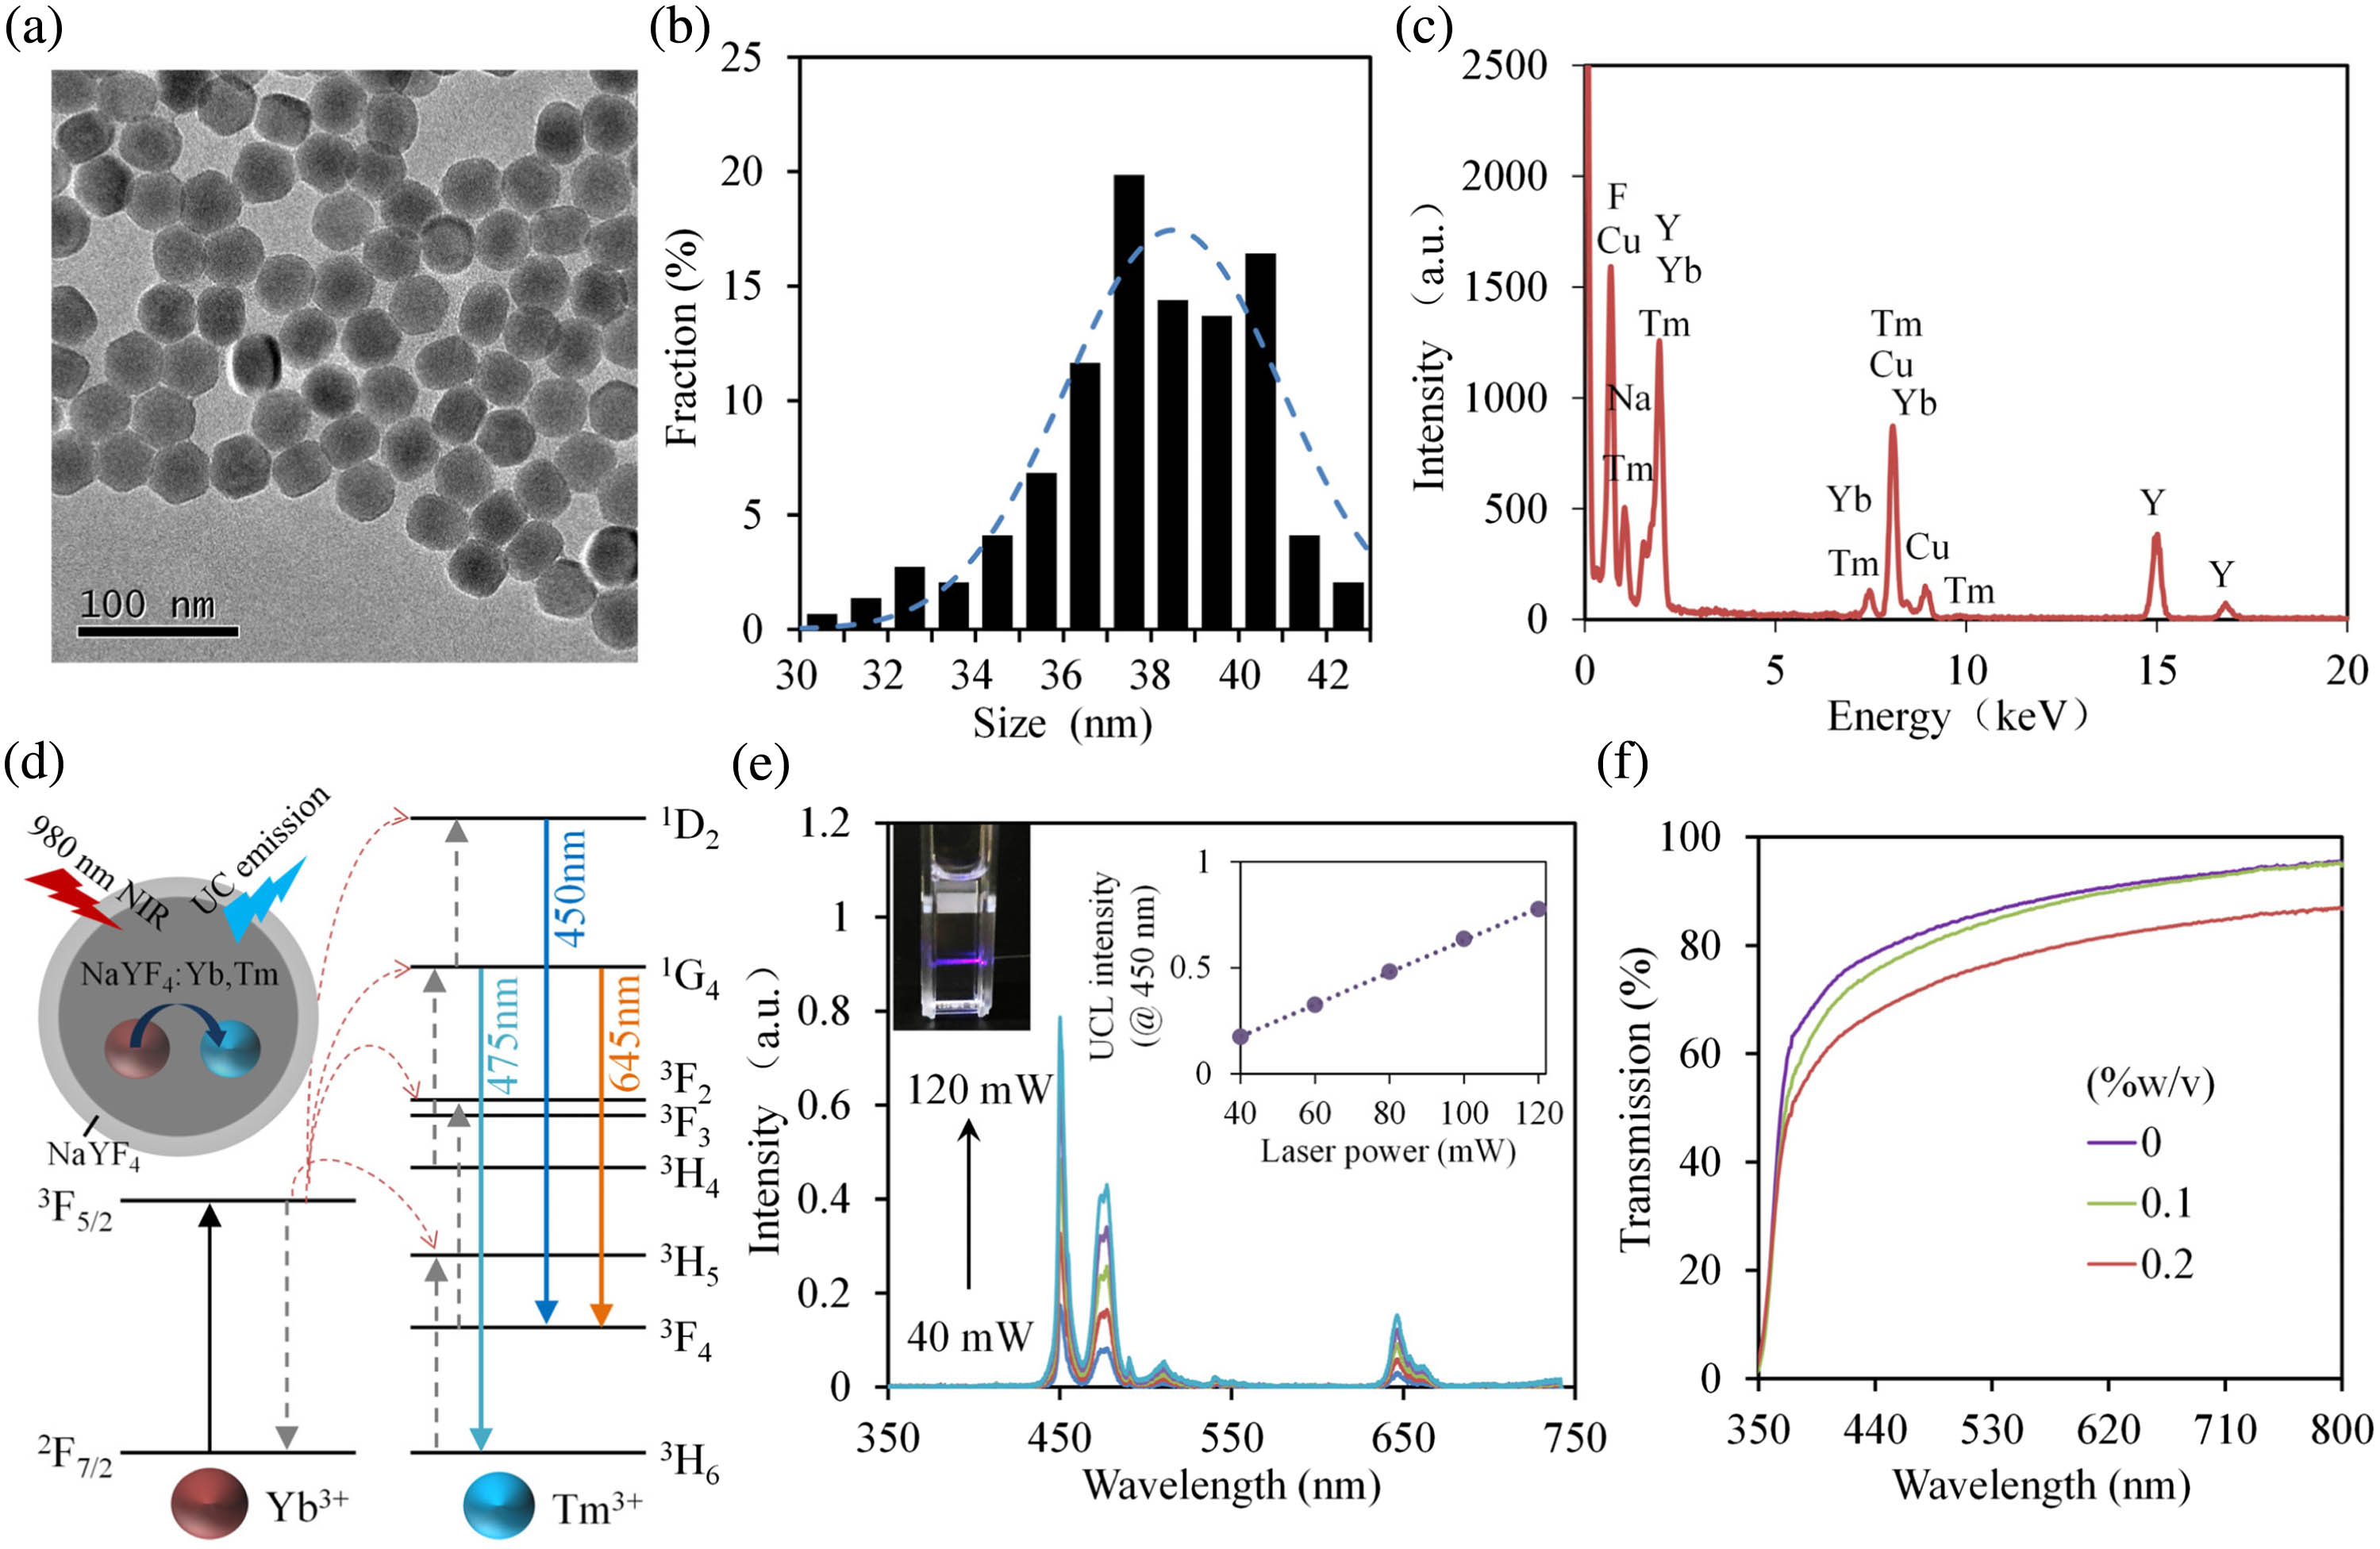
Fig. 1. (a) TEM images, (b) size distribution, (c) EDXA, and (d) schematics and upconversion process of the UCNPs. (e) Emission spectra of the UCNPs dispersed in water under different excitation powers. The concentration of the UCNPs is set at 0.1% w/v. The inset graph shows a linear relationship between emission intensity and excitation laser power. (f) Transmission spectra of hydrogel incorporated with various concentrations of UCNPs.
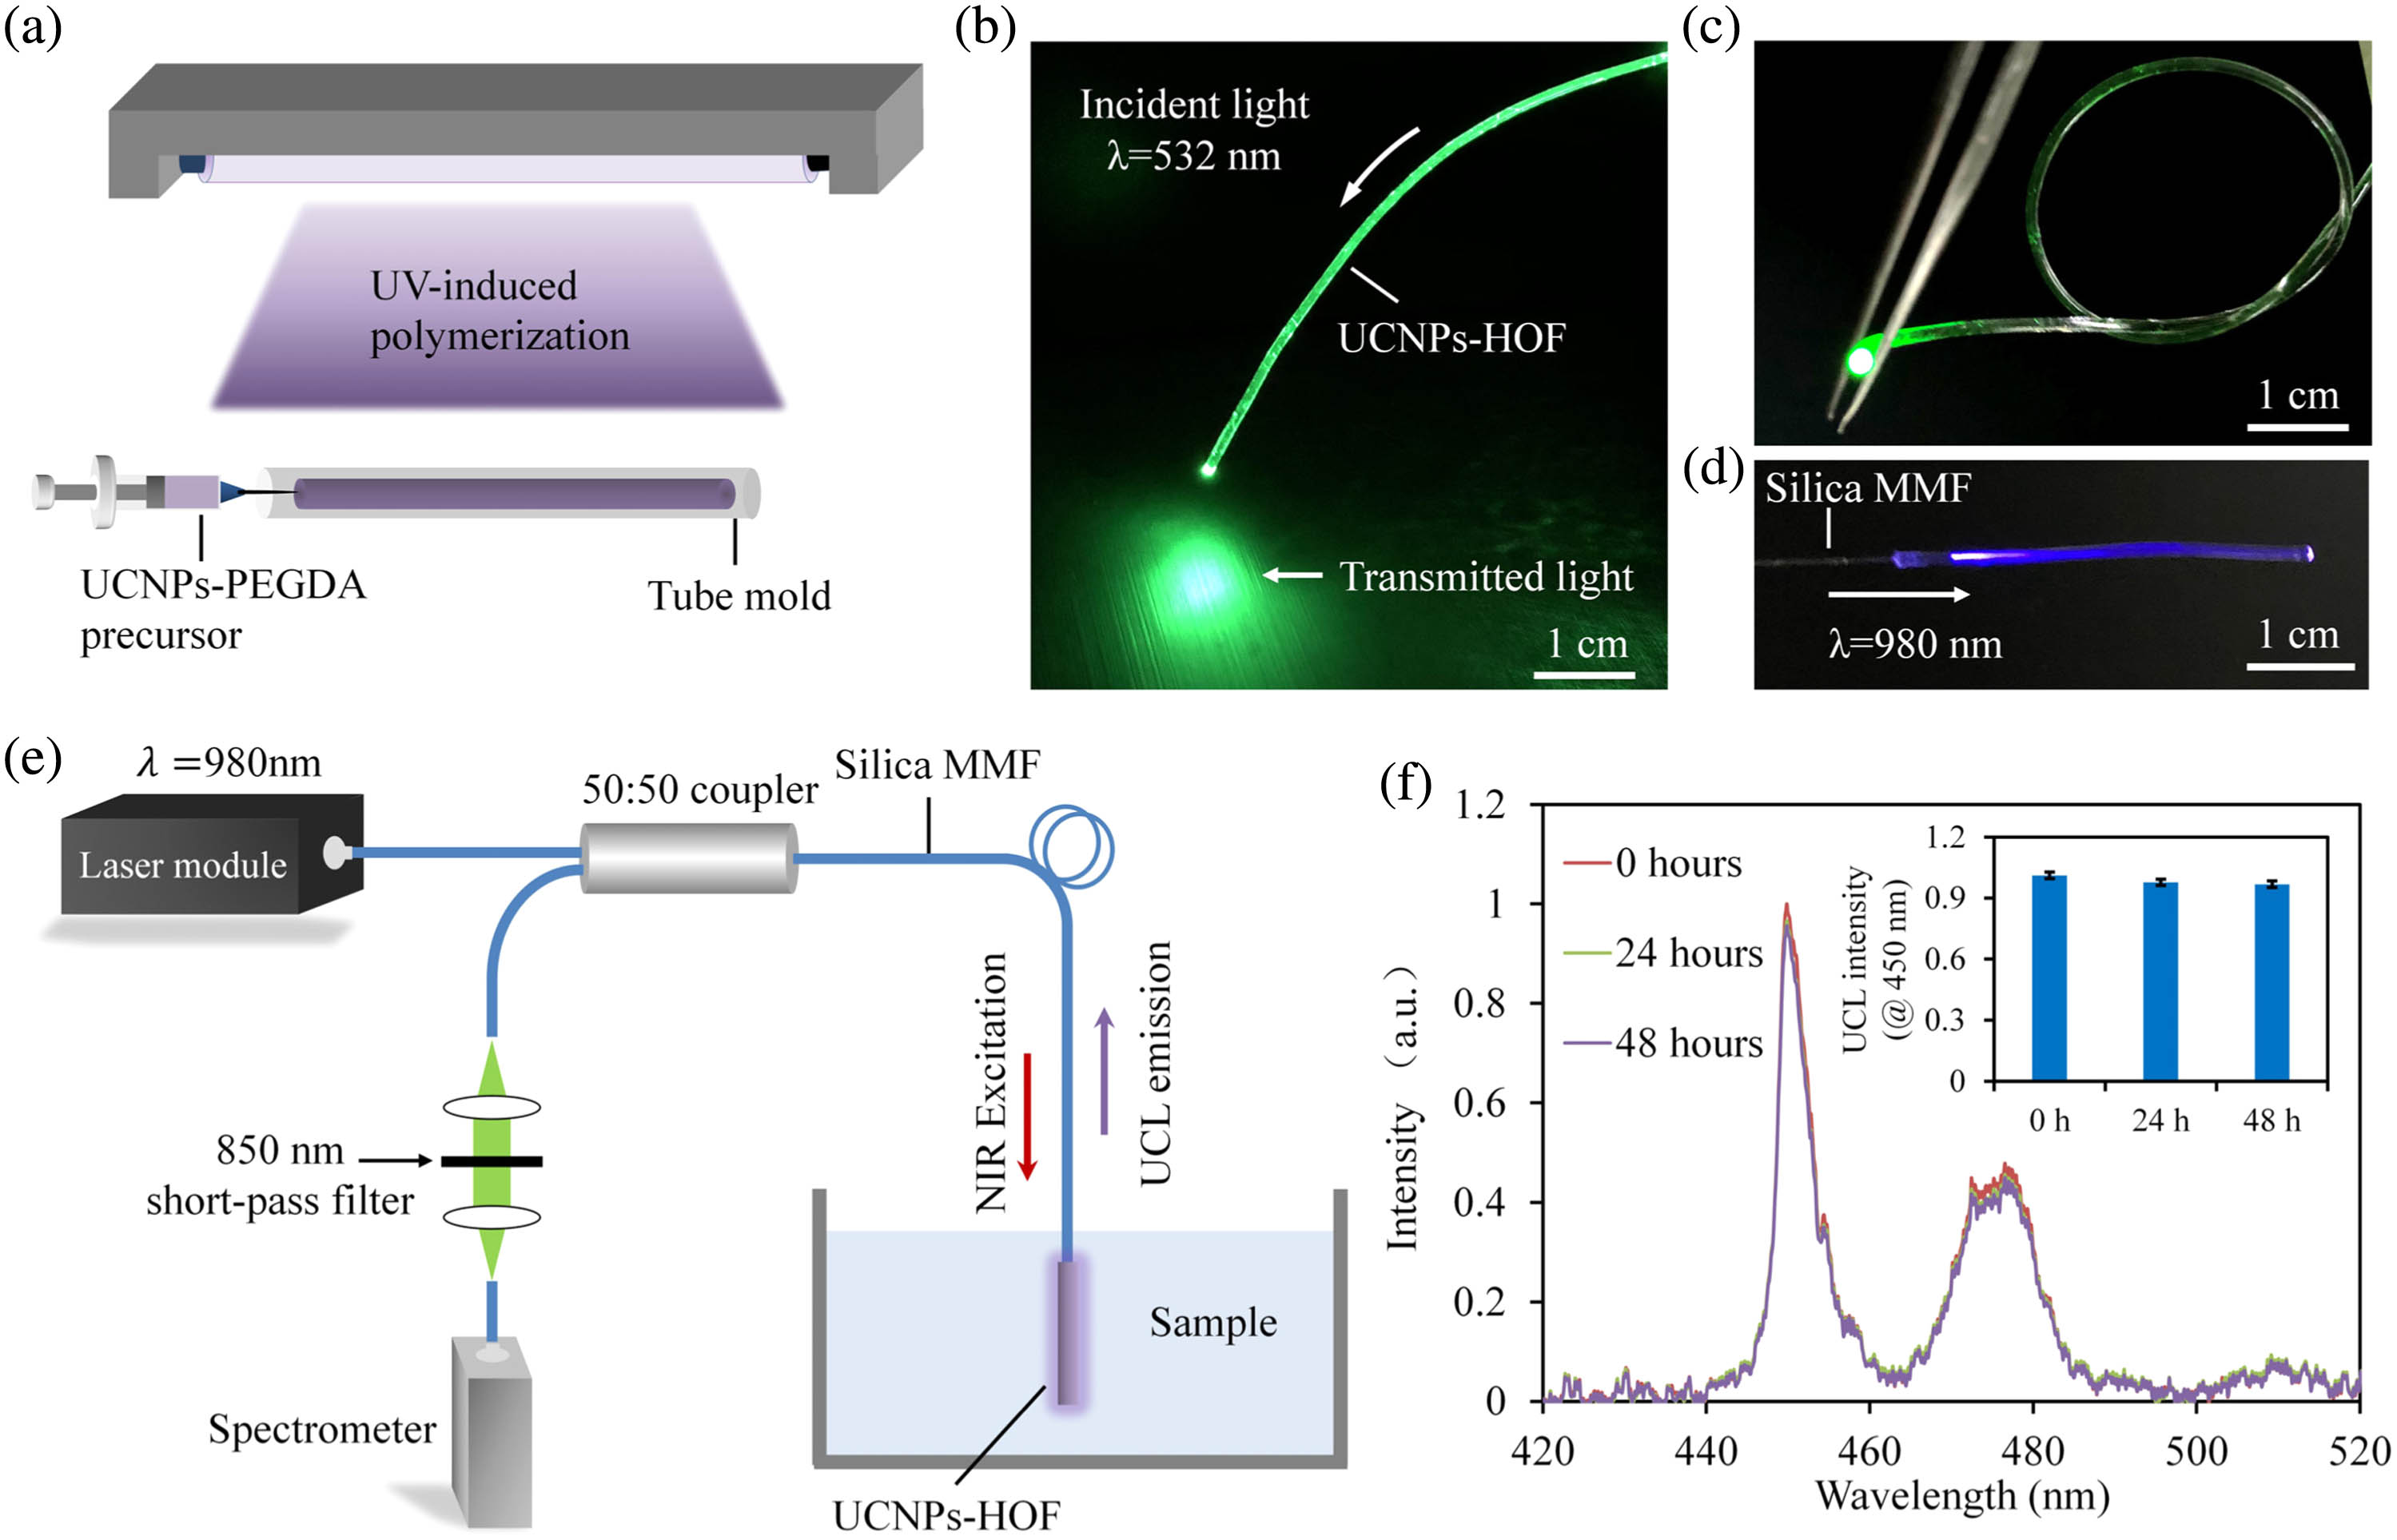
Fig. 2. (a) Fabrication of the UCNPs-HOF by molding and UV-induced crosslinking. (b) Coupling of a 532 nm laser to the UCNPs-HOF. (c) Mechanical flexibility. The UCNPs-HOF can effectively guide light even when tied into a knot. (d) Photograph showing blue UCL emission of the UCNPs-HOF under the illumination of an excitation laser at 980 nm. (e) Optical setup for interrogation of the sensing UCNPs-HOF. (f) Long-term stability.
Fig. 3. (a) Dependence of the UCL spectrum on temperature. The inset image describes the corresponding experimental setup, where the sensor is immersed in a heating water bath (Tris-HCl buffer, pH = 8.4 ionic strength = 150 m M pH = 8.4 ionic strength = 150 m M
Fig. 4. (a) Mechanism of the UCNPs-HOF for DA sensing. (b) Absorption spectra of DA and ox-DA, and emission spectrum of the UCNPs-HOF. (c) Emission spectra of UCNPs-HOF immersed in different samples containing DA, CaCl 2
Fig. 5. (a) UCL quenching ratios of the UCNPs-HOF for DA sensing at different pH values. The DA concentration is set at 100 μM. (b) Emission spectra of the UCNPs-HOF versus the concentration of DA (Tris-HCl buffer, pH = 8.4 ionic strength = 150 m M
|
Table 1. Determination of DA in Samples of Human Blood Serum


Set citation alerts for the article
Please enter your email address

© Copyright 2018-2021 | Chinese Laser Press. All Rights Reserved 沪ICP备15018463号-20