Ye ZHANG, Xiao YANG, Xin-Rui JIANG, Qi YANG, Bin DENG, Hong-Qiang WANG. Attitude direction estimation of space target parabolic antenna loads using sequential terahertz ISAR images[J]. Journal of Infrared and Millimeter Waves, 2021, 40(4): 496
Copy Citation Text
To monitor the working state of a space target, attitude direction estimation of parabolic antenna loads from a multi-view sequence of the terahertz (THz) inverse synthetic aperture radar (ISAR) images is developed. A space-based THz radar imaging system, which aims to achieve surveillance of high earth orbit satellite targets and small satellite targets, is proposed. Under the theorem that the projection of the parabolic antenna edge (a circle) along arbitrary observation direction is an ellipse, an improved Randomized Hough Transform is proposed to automatically detect and calculate the five key parameters of ellipse components from each THz ISAR image. To ensure the efficiency, accuracy, and robustness of the estimated attitude direction, a two-level estimation algorithm is proposed. The radius and three-dimensional center location of the antenna edge are estimated first. Then, taking these parameters as prior information, the attitude direction is estimated by solving an optimization to minimize the joint error about the length of semi-minor axis and the inclination angle of an ellipse. Electromagnetic scattering data of satellite model targets illustrate the effectiveness and robustness of the proposed method in attitude direction estimation of parabolic antenna loads.
To feed demands of national security and development of science and economy, many space-based systems, such as satellites and space stations, have been launched into space. Parabolic antenna load is a major component of satellite communication system, and its attitude direction and size are important information for monitoring and analyzing the working state and potential intention of a space target.
Until now, the detection sensors of space targets mainly include optical telescopes [1-2] and ground-based radars [3-5]. The optical telescopes are capable of observing space targets with high resolution, but the quality of the observation image is heavily dependent on the illumination condition. The ground-based radars can achieve all-day and all-weather monitoring and inverse synthetic aperture radar (ISAR) imaging of space targets and have become the most commonly used means in space target surveillance. However, it still exists some defects. Firstly, limited by the transmitting power, it is hard to detect high earth orbit (HEO) satellite targets and small satellite targets because of the remote transmission distance and small radar cross section (RCS). Secondly, at present, the ground-based radars are all operating below W-band to reduce the impact of atmospheric attenuation, which restricts the imaging resolution. Thus, it cannot achieve fine imaging and identification of space targets at component level. Thirdly, the change of the line of sight (LOS) elevation angle is inadequate to match up with that of the azimuth angle when observing a HEO target, which will lead to an unbalanced distribution of attitude parameters. If the observation diversity of LOS angles is significantly insufficient, it is difficult to estimate the accurate attitude direction of satellite loads, such as parabolic antennas and panels. To overcome these shortcomings, this paper proposes a space-based terahertz (THz) radar imaging system, which can achieve high-resolution imaging and identification of key components in both high earth orbit satellite targets and small satellite targets. THz waves are generally referred to the spectrum from 0.1 to 10 THz, which lies in the gap between the microwave and infrared. The space-based THz radar system holds the following characteristics: 1) THz radar is easy to achieve higher carrier frequency and greater usable bandwidth, which enables better spatial resolution and provides more details of space targets; 2) THz radar is small in size and light in weight. The carrier can flexibly adjust the orbit altitude to achieve sufficient observation of HEO satellites. Until now, THz SAR and ISAR imaging technology have made significant progress in ground and airborne applications [6-10] and showed great advantages in high-resolution imaging and target recognition. Considering that the atmospheric attenuation of THz wave in space is limited, the space-based THz radar holds great potential in space target surveillance.
Reviewing its development, the working state analysis technology of space targets by radar sensors generally can be sorted into two categories. The first works by matching the target features extracted from the radar echoes or images through maximum likelihood search with a pre-existing database [11-13], such as the RCS, the high-resolution range profiles, and the ISAR images. This sort of data-driven method performs well in some specific missions, but the searching process is too time-consuming to feed some circumstances with efficiency requirements. Besides, the method would fail in monitoring an unknown non-cooperative target. The second approach is to perform the three-dimensional (3-D) reconstruction. In Ref. [14], multi-static radar is adapted to reconstruct the 3-D geometry of low earth orbit (LEO) space targets through interference technology. However, this method depends on the complex radar system structure, and has not been widely used. At present, the most commonly used 3-D reconstruction approach is based on the sequential ISAR images [15-20]. In these literatures, the singular value decomposition (SVD) method[15-16] and factorization method[17-20] utilized in optical image reconstruction [21-22] were applied to decompose the multi-perspective range-Doppler (RD) history projection matrix into the LOS angle unit vector matrix and the target 3-D reconstruction result. Before 3-D reconstruction, the association of scattering points from different ISAR images should be accomplished in these methods. The commonly used scattering trajectory association methods include Kalman filter method [23], Kanade–Lucas–Tomasi (KLT) feature tracker method [19], and scale invariant feature transform (SIFT) method [20]. It should be noted that all these scattering trajectory association methods are based on the precarious point scattering center model assumption, which omit the angular glint phenomenon [24] in high-frequency radar measurements. In the THz band, Liu et al.[25] have investigated the aspect-dependent scattering characteristics of complex targets at 0.34 THz, and the experimental results showed that the scattering persistence angles of aspect-dependent scattering centers are no more than 5.5°. Thus, the complex structure of space targets will lead to a huge decline in precision and efficiency of scattering trajectory association from sequential ISAR images, which increases the failure risk of the 3-D reconstruction. As a result, it is difficult to achieve accurate attitude estimation in practical applications. To overcome the defects of point scattering center model-based 3-D reconstruction methods, Zhou et al.[26] have explored the shape feature of LEO satellite targets within the ground-based Ku-band ISAR sequence and achieved attitude estimation of rectangular components such as solar panels. For HEO satellite targets and small satellite targets that are mainly responsible for communication tasks, the size and attitude direction estimation of parabolic antenna loads is necessary for monitoring and analyzing their working state and potential intention. However, there is almost no relevant research at present.
In this paper, we propose a complete set of algorithms to estimate the attitude direction of parabolic antenna loads from sequential THz ISAR images, including sequential ISAR images acquisition, parabolic antenna components detection, and attitude direction estimation. The algorithms explore continuous changing of circular structures among sequential ISAR images to interpret the attitude direction information. The electromagnetic scattering characteristic of parabolic antenna is investigated. To obtain the significant edge information of parabolic antenna loads, the cross-polarization echo data of a satellite model are calculated. Under the theorem that the projection of the edge of a parabolic antenna (a circle) on arbitrary two-dimensional (2-D) plane is an ellipse, an improved Randomized Hough Transform (RHT) is proposed to automatically detect and calculate the five key parameters including center coordinates, lengths of semi-major axis and semi-minor axis, and inclination angle of ellipses from each THz ISAR image. The attitude direction is estimated based on a two-level estimation algorithm. Firstly, the antenna radius is estimated by averaging the lengths of semi-major axis, and the 3-D center location of the antenna edge is obtained through least squares estimation based on the detected center coordinates of ellipses and LOS angle projection matrix. Finally, taking the antenna radius and 3-D center location as prior information, the attitude direction is estimated through solving an optimization to minimize the joint error about the length of semi-minor axis and the inclination angle based on the particle swarm optimization (PSO) algorithm [27].
This paper is organized as follows. In Sect. 1, The observation geometry of space-based THz radar imaging system is described in detail. The electromagnetic scattering characteristic of parabolic antenna is investigated in Sect. 2. In Sect. 3, the implementation details of the proposed attitude direction estimation method are provided. Sect. 4 is the experimental part, including imaging performance comparison, attitude direction parameter estimation, and error analysis. Finally, conclusions are drawn in Sect. 5.
1 Observation geometry of space-based terahertz radar imaging system
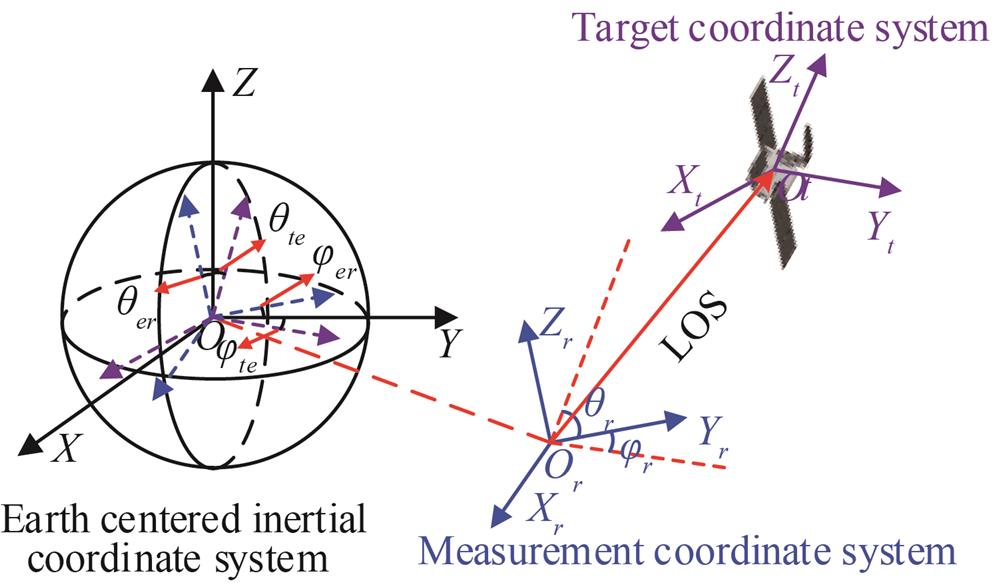
The space target observation geometry of space-based terahertz radar is illustrated in Fig. 1, in which - represents the earth centered inertial (EIC) coordinate system, - represents the measurement coordinate system of space-based terahertz radar, and - represents the target coordinate system, respectively. For a three-axis stabilized space target, its attitude will keep unchanged relative to the target coordinate system, and the projection on ISAR image plane depends on the instantaneous radar LOS angles and , which can be obtained from the ground-based radar tracking system [28] or the developed space-based terahertz radar tracking system. Supposing that the 3-D unit vector of attitude direction of a parabolic antenna load is
Figure 1.Space target observation geometry of space-based terahertz radar.
where and denote the elevation angle and azimuth angle of attitude direction, and they are defined in the same way as radar LOS angles and .
Based on the coordinate system transformation, the 3-D unit vector of the attitude direction in the radar measurement coordinate system can be expressed as
,
where is the transformation matrix from target coordinate system to EIC coordinate system, and is the transformation matrix from EIC coordinate system to radar measurement coordinate system. and are expressed as
, .
Similarly, for a scattering point located on the space target with 3-D coordinates , the 3-D coordinates in radar measurement coordinate system can be transformed as
,
According to the ISAR imaging theory, the imaging process of space targets is to project 3-D scattering points on a 2-D plane based on the radar measurement LOS angles. The projected 2-D coordinates on an ISAR image can be expressed as
,
where denotes the LOS angle projection matrix, and subscript denotes the serial number of ISAR images. It should be noted that the projected 2-D coordinates are derived under the circumstance that the azimuth angle changes continuously, and the elevation angle is almost constant within one ISAR imaging period.
Compared with traditional ground-based radars, a significant advantage of the space-based terahertz radar system is that the LOS elevation angle can be adjust flexibly through orbital transfer of the carrier, which helps to achieve sufficient observation of space targets with almost unchanged orbit inclination, such as HEO satellites and geosynchronous satellites. Sufficient LOS observation angles will ensure the accuracy and robustness of the attitude direction estimation algorithm.
This paper focuses on the attitude direction estimation of parabolic antenna loads, so the mature ISAR imaging theories are not described in detail. In the last few decades, the ISAR imaging methods have been intensively investigated, and representative works can be found in[29-31]. It should be noted that the terahertz radar holds a very high range resolution, and the range cell migration correction (RCMC) [32] must be performed in the terahertz ISAR imaging process.
2 Electromagnetic scattering characteristic of parabolic antenna
The geometry model of a paraboloid under Cartesian coordinate system is shown as Fig. 2, and its Cartesian coordinate equation is
where represents the focal length of the paraboloid. Considering that the paraboloid is rotationally symmetric, its projection, which is a parabola, on x-y plane is investigated. In Fig. 2, denotes the diameter, denotes the incident angle of plane wave transmitted by the radar, denotes the focal point, denotes the specular reflection point on the parabola with respect to the incident plane wave, denotes the length from to , and denotes the included angle between the y-axis and the line segment . A widely known conclusion about the parabola is , then the polar coordinate equation of the parabola can be expressed as
.
It can be seen from Fig. 2 that the position of the specular reflection point is sliding along the parabola with the continuous change of the incident angle of plane wave, and the corresponding angle range can be calculated as
.
Due to this special characteristic, the paraboloid belongs to the sliding scattering center [33], and the specular reflection point makes a major contribution to the RCS. Apart from the specular reflection point, the edge of the paraboloid will also contribute to the RCS [34]. However, once the specular reflection point exists, this minor contribution is hard to be noticed.
Based on the geometry optics theory [35], the sliding scattering center model, whose phase reference center is the bottom center of the paraboloid, of the specular reflection point can be established as
,
where denotes the wavenumber, denotes the speed of light, and denotes the operating frequency of radar. and are the two-principal radius of the curved surface at specular reflection point[36], and they are expressed as
.
Due to the position of the specular scattering point changes with the incident angle of plane wave, it is impossible to achieve association of any fixed scattering point on the surface of a parabolic antenna from different ISAR images, let alone reconstruct the 3-D geometry. Fortunately, the cross- polarization radar echoes provide a solution to this problem. Wang et al. [37] have illustrated that the cross-polarization radar image is more sensitive to the edges and corners. In this paper, the variant shape feature of the parabolic antenna edge among the cross polarized ISAR image sequence is adapt to interpret the attitude direction information. Utilizing this sort of high-level image feature for parameter estimation avoids the association difficulty in conventional factorization method.
To verify the reliability of the theory illustrated in this section, electromagnetic simulations of a parabolic antenna model are performed. The diameter and focal length of the paraboloid are 0.48 m and 0.24 m, respectively. From Eq. 9, we can calculate that the range of incident angle with specular reflection point is ,. The material is perfect electric conductor, and the geometric position is the same as Fig. 2. To simulate the real parabolic antenna load of space targets, the thickness of the antenna edge is set to 1 cm. The electromagnetic calculations are based on the physical optics, and the edge scattering has been taken into consideration[38-39]. The operating frequency of the THz radar ranges from 0.215 THz to 0.225 THz with 51 uniform sample points.
In the first simulation, the parabolic antenna model is static, and the incident angle ranges from -90° to 90° with 0.2° sample interval. The RCS curve at 0.22 THz is shown in Fig. 3. From Fig. 3, we can conclude three conclusions: 1) The scattering center model established in Eq. 1) well matches the electromagnetic calculation result, and the undulation of the RCS curve is mainly caused by the coherent accumulation of the scattering component contributed by antenna edge; 2) When the LOS angle is not perpendicular to the antenna edge, the scattering intensity of specular reflection point is far more than that of antenna edge; 3) Compared with the specular reflection point, the antenna edge has a depolarization effect, and the scattering intensity of cross polarization has a small diversity with respect to the incident angle.
Figure 3.RCS of the parabolic antenna model at 0.22 THz.
In the second simulation, the parabolic antenna model rotates 3° around the y-axis with 0.05° sample interval, and the incident angle is set 25° and 60°, respectively. Figure 4 shows the ISAR imaging results. Comparing Fig. 4(a) with Fig. 4(b), we can find that when the specular reflection point exists, the information of the other part in the parabolic antenna are greatly suppressed, and it is hard to judge whether a parabolic antenna exists or not. Comparing Fig. 4(b) with Fig. 4(c), it is obvious that the VV polarization image is sensitive to the face feature, but the VH polarization image is sensitive to the edge feature. Thus, the cross polarized ISAR images are more suitable for the attitude direction estimation of parabolic antenna loads.
Figure 4.ISAR images of the parabolic antenna model(a) φ=25°, VV polarization; (b) φ=60°, VV polarization; (c) φ=60°, VH polarization
Based on the basic theories in Section II and Section III, the complete attitude direction estimation algorithm of parabolic antenna loads is introduced in this section. The overall process of the attitude direction estimation scheme is concluded as the following steps:
Step 1: Adjust the orbit parameters of the space-based THz radar system to achieve a sufficient and effective observation of the parabolic antenna loads on a space target. The effective observation means that the LOS angle should be far away from the axis of parabolic antenna.
Step 2: Transform the LOS angle parameters obtained by the radar tracking system under EIC coordinate system into these under the radar measurement coordinate system based on the geometric relations described in Eq. 2.
Step 3: Adopt the RD algorithm with RCMC to obtain the sequential high-resolution THz ISAR images of the observed space target from the cross-polarized radar echoes. The azimuth scaling is achieved based on the LOS angle parameters and the sampling interval of slow time. If the ISAR images feed the requirement of attitude direction estimation, go to Step 4, otherwise, go to Step 1.
Step 4: The ISAR images are denoised and grayed. Utilize the morphology methods to corrode the target outline in each ISAR image, and the typical rectangle components can be removed based on the Radon transformation [40] or K-means clustering algorithm to reduce the computation complexity in the following parabolic antenna component detection operation.
Step 5: Perform the proposed improved RHT on each ISAR image to extract the five key parameters, which include the 2-D center coordinates, the length of semi-major axis and semi-minor axis, and the inclination angle, of the ellipse components projected by the antenna edge.
Step 6: Build the geometric projection matrix of each ISAR image with respect to the radar LOS angles, and estimate the antenna radius and the center coordinates of the antenna edge based on the extracted ellipse parameters in Step 5.
Step 7: Take the antenna radius and center location as prior information, and estimate the attitude direction through an optimization to minimize the joint error about the length of semi-minor axis and the inclination angle.
To show the process clearly, a flowchart is given in Fig. 5. The details of the key steps are given in the following subsections.
Figure 5.Flowchart of the attitude direction estimation process
An innovation of this paper is utilizing the robust shape feature of the parabolic antenna edge to replace the invalid point scattering center feature in the attitude direction estimation application. The edge of a parabolic antenna can be seen as a circle in 3-D free space, and except the extreme condition that the LOS angle is perpendicular to the circle, its projection along arbitrary LOS angle direction is an ellipse. Based on this theorem, the connection between the sequential ISAR images and structural characteristic of parabolic antenna loads can be established.
In the 3-D free space, a circle cannot be described by an explicit Cartesian coordinate equation, but it can be uniquely determined by the 3-D center coordinates, radius, and normal vector. For the parabolic antenna load, the normal vector corresponds to the attitude direction. Suppose the 3-D center coordinates, radius, and attitude angles of the edge of a parabolic antenna in the measurement coordinate system are , , and , respectively. The parametric equations of the antenna edge can be expressed as
,
where and denote two unit vectors and , respectively. and are perpendicular to the normal vector in Eq. 2, and they are also perpendicular to each other. is the rotation angle, which ranges from 0 to . Then, the projected 2-D coordinates of the circle on each ISAR image can be obtained from Eq.6 based on the LOS angle data. The corresponding projected ellipse on a 2-D plane can be expressed by
,
where denotes the parameter set of an ellipse, and it can be precisely calculated by solving a linear equation with more than four coordinate points. In addition to this general expression, an ellipse can also be determined by five key parameters including the 2-D center coordinates, the lengths of semi-major axis and semi-minor axis, and the inclination angle. In this case, the ellipse can be expressed as
,
where and denote the 2-D center coordinates, and denote the lengths of two semi-axis, and denotes the inclination angle. The relations between the five key parameters and the parameter set are
, , , , .
From Eq. 12 to Eq. 19, the complete projection relation from a 3-D circle to a 2-D ellipse is established. Once the parameters of a circle and LOS angle data are known, the five key parameters of the projected ellipse can be directly obtained. In this subsection, the derivation of complex geometric relations is avoided by solving a simple linear equation.
3.3 Automatic ellipse components extraction
Detecting specific curves (straight line, circle, ellipse, etc.) from an optical image is one of the basic tasks in computer vision, and the commonly used curve detecting methods are the Hough Transform (HT) and its variants [41]. These methods transform one pixel of the image space into a parameterized curve of the parameter space, and each parameter coordinate is used to represent a curve segment in the image space. However, the algorithm complexity increases exponentially with the increase of the number of parameters, which will result in a very long computing time if the number of parameters is larger than three. To overcome the shortcomings of HT, the Random Hough Transform (RHT) and its variants[42-43], which explore the shape features of the detected curves, have been investigated to extract the parameters of specific curves. Compared with HT, the RHT holds the advantages in high accuracy, low storage, low computing complexity, and infinite parameter space. Until now, the RHT has achieved big success in curve detection from optical images.
In this paper, we improve the RHT to achieve ellipse detection from the ISAR images. Different from the optical images, the projected ellipse edge of the parabolic antenna load on ISAR images has a certain thickness because of the limited resolution of radars, which can be seen from Fig. 4(c). To guarantee the precision and robustness in ellipse detection, the improved RHT utilizes the five or more strongest scattering points of the antenna edge projection to estimate the five key parameters of an ellipse.
We give the improved RHT procedure as follows:
ISAR image preprocessing: The ISAR images are denoised by the CLEAN algorithm[53] and transformed into binary images. To promote the efficiency of the improved RHT in ellipse detection, some invalid scattering points, such as the target side lobes in RD imaging, are reduced through image corrosion processing, and rectangle components, such as the polar panel, are removed through the Radon transformation or K-means cluster algorithm.
Step 1: Scan a binary image and put the coordinates of all the ‘on’ pixels into the pixel data set . Then, initialize a parameter data set and .
Step 2: Randomly pick five points out of in such a way that all points of have an equal probability to be taken as , then all points of have an equal probability to be taken as , etc.
Step 3: Solve five joint equations of Eq. 13 as to determine a parameter point . If , go to Step 4, otherwise go to Step 1.
Step 4: Calculate a parameter point based on Eq. 1) to Eq. 19. Search among set for an element such that , , , and , where ,,, and are given tolerances. If found, go to Step 6, otherwise, go to Step 5.
Step 5: Attach to an accumulating cell with score one and insert it into set as a new element. Go to Step 7.
Step 6: Increase the score of the accumulating cell of by one, and then check whether the increased score is smaller than a given threshold (e.g., ). If yes, go to Step 7, otherwise, go to Step 8.
Step 7: . If (e.g.,), then stop, otherwise, go to Step 2.
Step 8: Take as the parameters of a possible ellipse and take out of all the pixels lying on the curve. If there are such pixels and , then go to Step 9; otherwise, represents a false curve, return the pixels into set , then take and its accumulating cell out of set , and go to Step 2.
Step 9: Keep , , and in unchanged, and give both and a varying range (e.g., is half the range resolution of the THz radar) to generate a mask area. Select the coordinates of the top five or more strongest scattering points corresponding to the mask area in the ISAR image to calculate a parameter point as the final parameters of the detected ellipse. It should be noted that the strong scattering points are extracted in such a way that the strongest scattering point is extracted first, and the scattering points within the region of a given radius around this strongest scattering point are removed. Then, the next strongest scattering point is extracted, etc. Delete all the pixels corresponding to the mask area in the ISAR image from , reset and , and go to Step 2 to detect the next ellipse in the ISAR image.
Perform the improved RHT procedure on the sequential THz ISAR images, the successive projected ellipse parameters of the parabolic antenna loads can be obtained. Due to the positions of the strongest scattering points utilized to calculate ellipse parameters nearly locate on the antenna edge, the improved RHT ensures both the accuracy and robustness in the automatic ellipse components extraction process.
3.4 Attitude direction estimation of parabolic antenna loads
In this subsection, we build a series of LOS angle projection matrices to estimate the attitude direction from the automatically extracted ellipse components in the previous subsection. An intuitive way to estimate the attitude direction is searching the six parameters of the antenna edge at the same time to minimize the difference between the projected ellipse parameters and the detected ellipse parameters from sequential ISAR images. Based on the structural constraint of parabolic antenna components, the minimization is described as follows:
,
where is the ellipse parameter set projected by the antenna edge, whose parameter set is , and it can be obtained through Eqs.12-19. denotes the number of ISAR images, and ,, and denote the weight factors, which balance the confidence of different feature parameters. This process requires simultaneous optimization of six parameters, and except and , the ranges of the other four parameters are unknown. Besides, the optimization of multiple parameters usually takes a long processing time and is easy to fall into a local optimal solution.
To overcome the problems in multi-parameter optimization, a two-level estimation method is proposed in this paper. When a 3-D circle projects to a 2-D ellipse, there are two special characteristics. Firstly, the center of the 2-D ellipse is the projection of the center of the 3-D circle. Secondly, the length of the semi-major axis of the ellipse is the same as the length of the radius of the circle. Thus, the 3-D center coordinates and radius of the antenna edge can be estimated first. The estimated radius is
,
where means to take the maximum value. By collecting the LOS angle projection matrices in Eq.6, the 3-D center coordinates can be estimated through a least squares estimation:
,
where
.
Taking the estimated 3-D center coordinates and radius of the antenna edge as prior information, then the minimization is simplified as
,
where and , and the denominators and are used to normalize the parameters in different dimensions to balance the confidence, which aims to ensure the accuracy of estimated attitude direction.
In this paper, we adopt the classical PSO algorithm to solve the optimization. In the PSO algorithm, the particle position is the solution to minimize in Eq. 24, and it is expressed as
.
The objective function of the PSO algorithm is defined as
.
A brief flow of the PSO algorithm is given as follows:
Step 1: Set the number of particles and the maximum number of iterations. Generate the initial position and velocity of each particle by randomly sampling within the solution space and a preset maximum speed.
Step 2: Calculate the objective function of each particle. Find the position of global optimal solution Gbest searched by the swarm, and the position of historical optimal solution Pbest searched by each particle.
Step 3: Update velocity and position of each particle, and the classical updating rules are
, ,
where and are the velocity and position of the -th particle in the iteration, and are two random parameters uniformly distributed within , and are two learning rate weights that balance contributions of the global and local influence, is the inertia weight, and a relatively small weight is better for the local search, while a large weight is better for the global search. If the algorithm reaches the maximum number of iterations or a minimum error criterion, which refers to the minimum moving distances of Gbest and Pbest, is satisfied, go to Step 4, otherwise, go to Step 2.
Step 4: Output the position of the ideal particle .
Based on the PSO algorithm, the attitude direction parameters in the radar measurement coordinate system are estimated, and they can be converted to the other coordinate system according to Eq. 5.
3.5 Observation LOS angle constraint
It is well known that the ISAR image shows the projection of target on the LOS plane. Thus, if the LOS elevation angle is constant during the radar observation process, the points having the same azimuth coordinates in the same plane perpendicular to the LOS angle will project to the same point in the ISAR image. In this case, it is hard to reconstruct of the 3-D geometry of target based on the sequential ISAR images. For a parabolic antenna target, if the radar LOS angle is nearly parallel to the direction of the parabolic antenna, it will lead to insufficient observation. When the observation diversity of LOS angles is significantly insufficient, the optimization function in Eq. 26 possibly leads to a wrong solution. Conventional ground-based radar is static, and the variation of radar LOS angle depends on the movement of space targets. For an HEO target, the change of the LOS elevation angle is inadequate to match up with that of the azimuth angle, which easily leads to an insufficient observation. To overcome this shortcoming, the proposed space-based THz radar flexibly adjusts the orbital height to change the LOS elevation angle to achieve sufficient observation.
4 Experiment results and analysis
4.1 Imaging performance comparison
In this experiment, the imaging performance between the commonly used ground-based Ku-band ISAR system and the proposed space-based THz ISAR system is compared. The main parameters of the two radar systems are listed in Table 1. The target is a parabolic antenna model, whose size parameters are the same as that in Sect. 2, and the 3-D center coordinates and attitude direction angle in the measurement coordinate system are and , respectively. The observation LOS angles of two radars are the same, the elevation angle is , and the azimuth angle ranges from to . The azimuth resolution of Ku-band radar and THz radar is 17.15cm and 1.30cm, respectively. The equivalent observation scene is shown as Fig. 6. The noise-free VH-polarization echoes are calculated.
Figure 7 shows the ISAR imaging results of parabolic antenna model utilizing the two radars. It can be seen from Fig. 7(a) that the Ku-band ISAR system cannot achieve fine imaging of parabolic antenna edge because of its limited range resolution and azimuth resolution. Based on this ISAR image, it is hard to detect the existence of parabolic antenna component, let alone reconstruct the key parameters. In Fig. 7(b), it is easy to identify the parabolic antenna component, and the key parameters of the projected ellipse can be directly obtained based on the proposed improved RHT method in Sect. IV.
Figure 7.ISAR imaging results of the parabolic antenna model(a) Ku-band radar,(b) terahertz radar
This experiment verifies the superiority of THz radar on fine imaging and target recognition of small space targets. Actually, higher frequency THz radar, such as 440 GHz and 670 GHz, can obtain more refined ISAR imaging results. Then, the parabolic antenna edge in ISAR images will also be clearer to be identified, which will further increase the estimation accuracy of attitude direction. Nonetheless, taking the current technic level of high-power THz device and complexity of electromagnetic calculation into consideration, this paper only concentrates on the research at 220 GHz band.
4.2 Attitude direction estimation results
In this experiment, we utilize the proposed method to estimate the attitude direction of the parabolic antenna load on a space target. The target is a simplified satellite model including a parabolic antenna load, a solar panel, and a main body, as shown in Fig. 8. The length and width of the solar panel is 1.6 m and 0.4 m, respectively. The size parameters of the parabolic antenna are the same as that in Section III, and the 3-D center coordinates and attitude direction angles in the measurement coordinate system are and , respectively. The simulation adopts a 220 GHz ISAR system and known angle tracking data to generate a long-time observation image sequence. The main parameters of the THz ISAR system are the same as that in Table 1. The VH-polarization echoes are calculated. The simulated sequence includes 10 RD images, and the signal-to-noise ratio (SNR) of each image is 10 dB. The simulated tracking LOS angle trajectory is shown as Fig. 9. The echo data corresponding to the red solid line are utilized to generate the ISAR images, and the other part of the LOS angle trajectory is the orbit adjustment stage to achieve sufficient observation.
Figure 8.Simplified three-dimensional satellite model
The sequential THz ISAR imaging results with RCMC are shown as Fig. 10. Obviously, the cross-polarized ISAR images are sensitive to the edges and corners of the targets. After the image preprocessing, the solar panel component appeared as parallelogram in the ISAR images can be detected utilizing the Radon transformation method[31], and the detection results are shown as Fig. 11. The main purpose in detecting the solar panel component is to reduce the computation complexity in the following parabolic antenna component detection operation. It should be noted that the marked blue solid lines have been expanded by ten pixels to ensure that the solar panel component can be removed as much as possible. Remove the scattering points located on the detected area of the solar panel, the residual scattering points are utilized to detect the parabolic antenna component based on the proposed improved RHT method. The parabolic antenna detection results are shown as Fig. 12. In the improved RHT method, the tolerances ,,, and are set 2 mm, 2 mm, 2 mm, and 5 degrees, respectively. The score number is set 3, and the maximum searching number is set 50 000. It can be seen from Fig. 12 that the parabolic antenna component in each ISAR image has been detected, and the detection results match the real shape of the projection of the parabolic antenna edge well. The detection process of parabolic antenna component in each ISAR image is repeated by 50 times to debase the contingency, and the mean absolute errors of the five estimated key parameters of the ellipse in each ISAR image are shown as Fig. 13. It can be seen that the maximum error of , , and is less than 2 cm, and the maximum error of is less than 10 degrees. This result verifies the efficiency of the proposed improved RHT method in automatically detect the parabolic antenna component from sequential THz ISAR images.
Taking the parameter set of each ISAR image and tracking LOS angle data as prior information, the 3-D center coordinates and radius of the parabolic antenna edge are estimated based on Eq. 21 and Eq.22. Finally, according to the optimization in Eq.26, the attitude direction parameters of the parabolic antenna load are solved by the PSO algorithm. The number of particles, the maximum number of iterations, and the maximum speed of particle are set 30, 100, and 5, respectively. The values of , and are all set 1. The PSO algorithm is repeated by 50 times to ensure the reliability of the estimated attitude direction parameters. The estimation results of the parabolic antenna parameters are given in Table 2. Compared with the real parameters of the parabolic antenna model, the direction estimation accuracy of both elevation angle and azimuth angle is about 1 degree, and the estimation accuracy of radius is superior to 5mm. This experiment illustrates the effectiveness and robustness of the proposed method in attitude direction estimation of parabolic antenna load.
Parameter type
True value
Estimated value
Absolute error
Center coordinates
Length of radius
0.25 m
0.246 5 m
0.003 5 m
Attitude direction
Table 2. Estimation Results of Parabolic Antenna Parameters
Under ideal condition, three ISAR images are enough to accurately estimate the attitude direction. However, in the real application, there always exists some accidental errors in the attitude direction estimation process. The errors in the proposed attitude direction estimation process in this paper can be concluded as the following three aspects:
1) Although the RD imaging process has taken the range cell migration of the target into consideration, the RD imaging results still exist position errors introduced by the approximation of the RD imaging algorithm and gridding of the ISAR images.
2) Limited by the geometric relation between radar and target, in several of the sequential THz ISAR images, the RD imaging results of the parabolic antenna load may have relatively poor image quality, which will affect the accuracy of the extracted ellipse parameters based on the improved RHT method.
3) The two-level estimation method proposed in this paper firstly estimates the center and radius of the parabolic antenna load. Then, taking these estimated parameters as priori information, the attitude direction parameters are estimated based on the PSO algorithm. In this process, there exists a transferring error.
Taking these possible errors into consideration, more than three ISAR images should be obtained to ensure the robustness of the attitude direction estimation results. To investigate the influence of the number of ISAR images on attitude direction estimation, we estimate the attitude direction utilizing different ISAR images, and the corresponding absolute errors of the estimated attitude direction parameters with 50 repetitions are shown as Fig. 14. It can be seen that when the number of ISAR images is larger than 3, the absolute errors of both estimated elevation angle and azimuth angle are below 2 degrees. Besides, the absolute errors of the estimated attitude direction parameters are not proportional to the number of used ISAR images because of the diversity image quality.
Figure 14.Absolute error of attitude direction parameters
To monitor and analyze the working state and potential intention of a space target, this paper takes the lead in providing a complete set of theories to estimate the attitude direction of parabolic antenna loads. Both the imaging system and method are novel. The proposed space-based THz radar system can achieve successively sufficient observation and high-resolution imaging of both high earth orbit satellite targets and small satellite targets. Taking the electromagnetic scattering characteristics of parabolic antenna into consideration, the proposed attitude direction estimation algorithm utilizes the robust shape feature of parabolic antenna edge to replace the invalid point scattering center feature. Accommodating the ISAR geometric projection matrices, the attitude direction is recovered through a optimization with automatically detected shape parameters, which is solved by a two-level estimation algorithm including the least squares estimation and PSO. Simulation experiments have illustrated the effectiveness and robustness of the proposed method. It should be noted that the proposed algorithm is limited to the three-axis stabilized space targets. Attitude direction estimation of parabolic antenna loads on an instable satellite is our research focus in the next stage.
Ye ZHANG, Xiao YANG, Xin-Rui JIANG, Qi YANG, Bin DENG, Hong-Qiang WANG. Attitude direction estimation of space target parabolic antenna loads using sequential terahertz ISAR images[J]. Journal of Infrared and Millimeter Waves, 2021, 40(4): 496