
Wei Song, Xiaochen Liu, Dongmei Huang, Kelin Sun, Bing Zhang. Construction of Video Quality Assessment Dataset for Deep-Sea Exploration[J]. Laser & Optoelectronics Progress, 2022, 59(17): 1733001
- Laser & Optoelectronics Progress
- Vol. 59, Issue 17, 1733001 (2022)
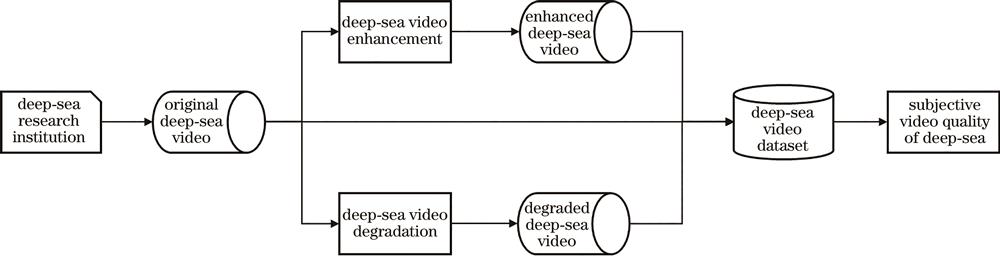
Fig. 1. Flow chart of constructing the underwater video quality assessment dataset
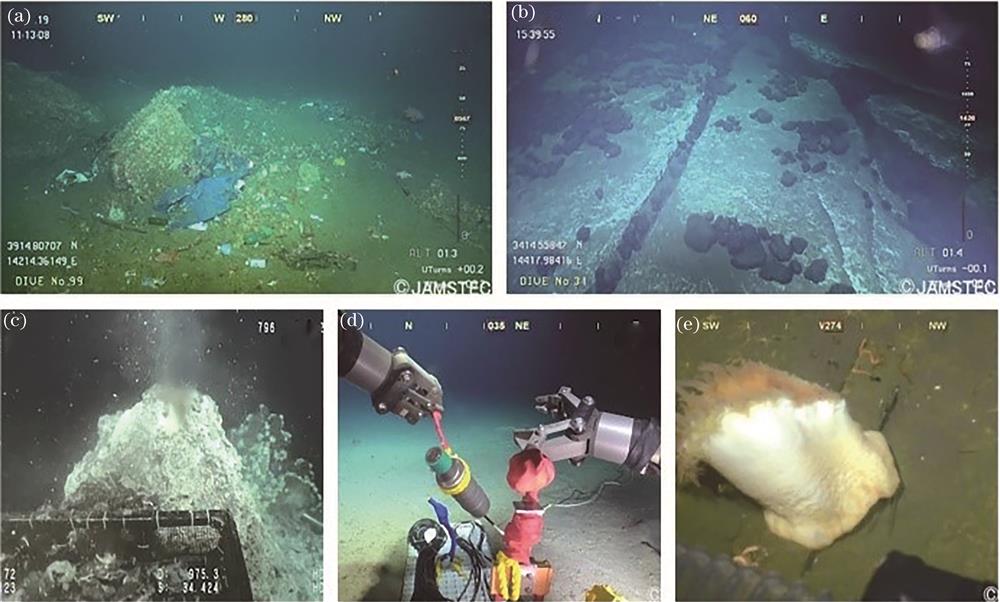
Fig. 2. Examples of five classes of contents about underwater videos. (a) Submarine rubbish; (b) submarine topography; (c) hydrothermal vents; (d) marine operation; (e) marine life
Fig. 3. Original and Fusion enhanced underwater images. (a) Original image; (b) image enhanced with Fusion model
Fig. 4. Original and Ucolor enhanced underwater images.(a) Original image; (b) image enhanced with Ucolor model
Fig. 5. ROI area (inside the box) and non-ROI area (outside the box) of a single frame
Fig. 6. Flow chart of subjective assessment of video quality
Fig. 7. Subjective video quality assessment system. (a) Viewing interface; (b) assessment interface
Fig. 8. Performance of underwater enhancement models in low light environment. (a) Original frame, MOS is 28.1; (b) enhanced by Fusion, MOS is 17.2; (c) enhanced by Ucolor, MOS is 20.9
Fig. 9. Performance of underwater enhancement models in color cast environment. (a) Original frame, MOS is 43.6; (b) enhanced by Fusion, MOS is 58.4; (c) enhanced by Ucolor, MOS is 50.4
|
Table 1. Details of video quality degradation parameters
| ||||||||||||||
Table 2. Subjective performance of video quality enhancement and degradation methods
| |||||||||||||||||||||||||||||||||||||||||
Table 3. Performance comparison of different image/video quality assessment models on the dataset constructed in this paper
| |||||||||||||||||||
Table 4. Results of video quality assessment models on different underwater video datasets
|
Table 5. Correlation analysis of video quality characteristics

Set citation alerts for the article
Please enter your email address
© Copyright 2018-2021 | Chinese Laser Press. All Rights Reserved 沪ICP备15018463号-20