
Zhaoyang XIA, Hui WANG, Jinghong FANG, Yang ZHANG, Chaoyue WANG, Huan HE, Jinqi NI, Yun SHI, Qin LI, Jianding YU. Co Incorporation on Structure, Conductivity and Magnetism of GaFeO3 [J]. Journal of Inorganic Materials, 2021, 36(3): 319
- Journal of Inorganic Materials
- Vol. 36, Issue 3, 319 (2021)
Abstract
Multiferroic materials have recently attracted extensive attention due to their attractive physical properties, such as ferromagnetism, ferroelectricity and ferroelasticity. Moreover, these coexisting properties can also result in coupling effects, such as the magnetoelectric (ME) effect, the cross-coupling between the ferromagnetic and ferroelectric properties. Based on the modified requirements: multifunctional, miniaturized and high-performance circuit, the storage devices are seeking for other possibilities except the traditional semiconductor technics[
As a member of multiferroic family, GaFeO3 (GFO) is one of the most promising materials because of its good piezoelectricity at room temperature[
The conduction mechanism of GFO ceramics is studied through annealing at different atmosphere, and it was found that the leaky behavior of GFO mainly results from the oxygen vacancies and Fe valance fluctuation[
1 Experimental
A series of GaFe1-xCoxO3 (x= 0, 0.02, 0.05, 0.07, 0.10) ceramics have been fabricated with conventional solid- state sintering technology. The starting powders including gallium oxide [Ga2O3, (99.99%, aladdin)], ferric oxide [Fe2O3 (99.99%, Rare Metallic Co Ltd)] and cobalt monoxide [CoO (AR, aladdin)] were carefully weighed in stoichiometric ratio and thoroughly balled-milled with absolute ethanol and agate balls for 12 h. After that, the mixed powder was dried and passed through a 100-mesh (150 μm) sieve. The dried mixture was precalcined at 900 ℃ in air in a muffle furnace for 6 h. After it cooled down, the mixture was ground into powder again and pressed into rods by the cold isostatic press, then the rods were calcined at 1350 ℃ in air for 10 h afterwards. Samples with different cobalt contents, 0, 2at%, 5at%, 7at%, and 10at% were denoted as GFCO-0, GFCO-1, GFCO-2, GFCO-3, and GFCO-4, respectively. The as-prepared samples were sliced into flat pieces or ground into powder for further measurement.
The powder X-ray diffraction patterns (XRD) for the crushed GFCO ceramics were obtained at room temperature using an Ultima-IV (l=0.15406 nm) with CuKa radiation (l=0.15406 nm), and the step scan mode was chosen with 0.01° per step and 2 s collection time. Refinement of the lattice constants was achieved with the Fullprof package. The morphology of the GFCO-x ceramics was observed with scanning electron microscopy (SEM, S-3400N TypeI), and the homogeneity of the components was determined with energy-dispersive X-ray spectroscopy (EDX, S-4800). A physical properties measurement system (PPMS-9(dxl)) was used to investigate the magnetization of the samples. The M-H loops were carried out at 300 K with a field of 1.58´105 A/m, while the magnetization versus temperature curves were obtained with a field of 7.9´104 A/m and between 50 and 390 K. For the measurement of the ferroelectric properties, electrodes were prepared on the samples via gold electroplating. I-V curves and P-E loops at room temperature were measured using a Keithley 6517B electrometer and ferroelectric analyzer (TF2000E).
2 Results and discussion
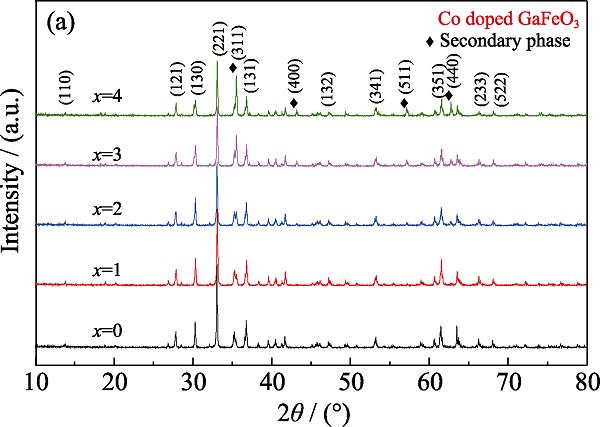
The XRD patterns of the GFCO-x ceramics at room temperature are shown in Fig. 1. The XRD spectra confirmed that cobalt was doped in the gallium ferrite without original phases, such as CoO, Fe2O3, Ga2O3. There were two phases observed, one was GaFe1-xCoxO3 possessed an orthorhombic structure with Pc21n space group, the other was secondary phase with a cubic structure and the Fd3¯m space group. The FullProf package was used to obtain the Rietveld refinement results, which were exhibited in Fig. 2. The refinement results also obtained the ratio of both phases which were listed in Table 1. The refined lattice parameters of the undoped GFO, namely, a=0.873659 nm, b=0.938267 nm, and c=0.50766 nm, are consistent with those in previous reports[
Fig. 3 depicted the variation in the cell parameters of GFCO-x, and the cell unit volume and lattice parameters decreased with the incorporation of Co, which correlated with the ionic radius of Co2+ (0.074 nm) and Co3+ (0.061 nm) being smaller than that of Fe2+ (0.078 nm) and Fe3+ (0.064 nm). The orthorhombic distortion values (c/a and $\sqrt{2}$ c/b) were 0.581074 and 0.765176 for GFO, respectively, while the values of c/a and $\sqrt{2}$ c/b for GFCO-x (0.58116 and 0.765325, 0.51221 and 0.765472, and 0.581314 and 0.765560, respectively) were larger than those of GFO, which implied an increase in the lattice distortion. The numerical criteria RWP and χ2 were 15-18 and 1-2, proving reliability for this refinement.
Fig. 4 illustrates the morphologies of the GFCO-x samples. The particle size ranged from 2-14 μm, and their average sizes were 6.7, 4.4, 5.4, and 5.1 μm, respectively. Hence, the proportion of grain boundaries increased due to the incorporation of Co. Abnormally small grains denoted as the secondary phase were observed because of the doping of Co. In addition, the EDX results of GFCO-1, as shown in Fig. 4(e), confirmed the existence of secondary phase and suggested that the chemical compositions of the samples comprised GaFe0.99Co0.01O3 for the main phase and Ga0.9Fe1.4Co0.7O4 for the secondary phase. Moreover, the microstructure of the secondary phase is identical to Ga doped CoFe2O4[
![]()
Figure 1.XRD patterns of GFCO-
| Sample | Main phase | Secondary phase |
|---|---|---|
| GFCO-0 | 100.00(0.88) | - |
| GFCO-1 | 98.37(0.95) | 1.63(0.20) |
| GFCO-2 | 96.43(0.49) | 3.57(0.18) |
| GFCO-3 | 77.52(0.94) | 22.48(0.50) |
Table 1.
Phase ratios for GFCO-
![]()
Figure 2.Rietveld refined XRD patterns of GFCO-
![]()
Figure 3.Composition versus cell unit parameters for (a)
The curves for the current density versus applied field for the GFCO-x (x=0, 1, 2) samples measured by a ferroelectric analyzer (TF2000E) are shown in Fig. 5(a). The current density decreased greatly due to the presence of Co, especially when doping a slight amount, while the insets of Fig. 5(a) showed that the polarization value decreased drastically. However, the current density increased so rapidly when the Co content reached 7% that we could not measure the current with the same tester. Instead, the current was measured with a Keithley 6517B electrometer, as shown in Fig. 5(b), while it’s obvious that the incorporation of 2at% cobalt decreased leakage current density sharply.
![]()
Figure 4.SEM morphologies of GFCO-
![]()
Figure 5.(a) Current density curves as a function of applied field in the GFCO-
The variation in the current density versus Co content as depicted in Fig. 5(b), is similar to that for GFO-doped Ni[
Oxygen vacancies produced inevitably during the preparation of GFCO ceramics can be written as:
where $\text{O}_{\text{O}}^{\times }$ is the loss of lattice oxygen, and ${{\text{{V}''}}_{\text{O}}}$ is a vacancy in the oxygen site with double positive charge. The released charge may be captured by Fe3+ ions to satisfy the charge balance, and then Fe3+ is reduced to Fe2+:
The coexistence of Fe3+ and Fe2+ allows electrical conduction via the hopping mechanism. However, the substitution of Fe with Co creates holes according to:
Where $\text{C{o}'}_{\text{Fe}}^{{}}$ indicates that Co is in the Fe site and has an extra negative charge, and ${{h}^{\centerdot }}$ stands for a hole. These holes are recombined with electrons as follows:
It is believed that the charge carriers are responsible for the leakage current of GFCO, and the recombination of holes and electrons weakens this electrical conduction.
Another reason for the decreased electrical conduction is the incorporation of elements that cause a large lattice distortion and increase the scattering of the conduction electrons. As mentioned earlier, the values of c/a and $\sqrt{2}$c/b for the GFCO-x samples are larger than those for the GFO, which indicates a larger lattice distortion. Fig. 5(b) shows that the leakage current density decreased by almost seven orders of magnitude; nonetheless, referring to published reports, the incorporation of elements reduced the leakage current density by up to four orders of magnitude at most[
Fig. 6(a) shows the M(T) curves for the GFCO-x (x= 0, 1, 2, 3, 4) samples, which were measured in zero-field- cooled (ZFC) mode. The hysteresis loops of all GFCO samples at room temperature with an applied field of 20000 Oe were displayed in Fig. 6(b). Fig. 6 indicated that the Co doping GFO ceramics owned enhanced magnetism which is in accordance with previous results[
![]()
Figure 6.(a) Temperature dependence of the magnetization for GFCO-
3 Conclusion
In conclusion, GaFe1-xCoxO3 (x=0, 0.02, 0.05, 0.07, 0.10) ceramics were prepared by the conventional solid-state method. X-ray characterization and Rietveld refinement results revealed that the as-prepared GFCO-x samples possessed an orthorhombic crystal structure with a Pc21n space group for the GFO and a cubic crystal structure with a Fd¯3m space group for the secondary phase. Moreover, the more Co content was doped, the higher proportion of the secondary phase there was, so did the degree of crystal distortion. The surface morphology of the GFCO samples was analyzed using SEM, which indicated that the mean grain size diminished and the proportion of grain boundary increased because of the presence of Co. The Co content doping and secondary phase decreased the leakage current effectively, especially the leakage current of the 2at% Co-doped GFO ceramics decreased by approximately 7 orders of magnitude compared to that of the undoped GFO ceramics. Moreover, doping Co improved the magnetic property because of the secondary phase and enhanced lattice distortion. This work shows that Co has a positive influence on magnetism and trace amounts of Co incorporation in GaFeO3 can decrease leakage current sharply, while excess Co leads to the drastic rebound in leakage current.
References
[2] M FIEBIG, T LOTTERMOSER, D MEIER et al. The evolution of multiferroics. Nature Reviews Materials, 1, 16046(2016).
[3] X WEI Y, Q JIN C, M ZENG Y. Progress of relaxor multiferroic materials. Journal of Inorganic Materials, 32, 1009-1017(2017).
[4] F SCOTT J. Multiferroic memories. Nature Materials, 6, 256-257(2007).
[5] M BIBES, A BARTHÉLÉMY. Towards a magnetoelectric memory. Nature Materials, 7, 425-426(2008).
[6] A ROY, S MUKHERJEE, R GUPTA et al. Structure and properties of magnetoelectric gallium ferrite: a brief review. Ferroelectrics, 473, 154-170(2014).
[7] H YAN, Y HUANG, W CUI et al. Magnetic properties and crystal structure of Ga2-
[8] C ABRAHAMS S, M REDDY J, L BERNSTEIN J. Crystal structure of piezoelectric ferromagnetic gallium iron oxide. The Journal of Chemical Physics, 42, 3957-3968(1965).
[9] S MUKHERJEE, V RANJAN, R GUPTA et al. Compositional dependence of structural parameters, polyhedral distortion and magnetic properties of gallium ferrite. Solid State Communications, 152, 1181-1185(2012).
[10] E TRONC, C CHANÉAC, J P JOLIVET. Structural and magnetic characterization of
[11] T ARIMA, D HIGASHIYAMA, Y KANEKO et al. Structural and magnetoelectric properties of Ga2-
[12] C HAN T, Y CHEN T, C LEE Y. Grain size effect on site-disorder and magnetic properties of multiferroic GaFeO3 nanoparticles. Applied Physics Letters, 103, 232405(2013).
[13] F POPOV Y, M KADOMTSEVA A, G P VOROB’EV et al. Magnetoelectric effect and toroidal ordering in Ga2-
[14] B MOHAMED M, A SENYSHYN, H EHRENBERG et al. Structural, magnetic, dielectric properties of multiferroic GaFeO3 prepared by solid state reaction and Sol-Gel methods. Journal of Alloys and Compounds, 492, L20-L27(2010).
[15] K SZYMAŃSKI, L DOBRZYŃSKI, M BAKR et al. Fe cation occupancies in GaFeO3 prepared by Sol-Gel and solid-state reaction. Phase Transitions, 83, 824-835(2010).
[16] K MUKHOPADHYAY, S MAHAPATRA A, K CHAKRABARTI P. Enhanced magneto-electric property of GaFeO3 in Ga1-
[17] A GHANI, S YANG, S RAJPUT S et al. Electric modulation of conduction in multiferroic Ni-doped GaFeO3 ceramics. Journal of Physics D: Applied Physics, 51, 225002(2018).
[18] C LEFEVRE, H SHIN R, H LEE J et al. Reduced leakage currents and possible charge carriers tuning in Mg-doped Ga0.6Fe1.4O3 thin films. Applied Physics Letters, 100, 262904(2012).
[19] N SHARMA, S KUMAR, K MALL A et al. Effect of Zn Doping on Structural and Ferroelectric Properties of GaFeO3 for Futuristic Spintronic Applications. 2018 IEEE 13th Nanotechnology Materials and Devices Conference (NMDC), IEEE, 1-4(2018).
[20] A THOMASSON, S CHERIFI, C LEFEVRE et al. Room temperature multiferroicity in Ga0.6Fe1.4O3: Mg thin films. Journal of Applied Physics, 113, 214101(2013).
[21] H OH S, H SHIN R, C LEFÈVRE et al. Incorporation of cobalt ions into magnetoelectric gallium ferrite epitaxial films: tuning of conductivity and magnetization. RSC Advances, 5, 34265-34271(2015).
[22] RAJEEV KUMAR, ASHISH MALL KUMAR, RAJEEV GUPTA et al. Raman Effect, Structural and Dielectric Properties of Sol-Gel Synthesized Polycrystalline GaFe1-
[23] C HAN T, C LEE Y, T CHU Y. Effect of cobalt doping on site-disorder and magnetic behavior of magnetoelectric GaFeO3 nanoparticles. Applied Physics Letters, 105, 212407(2014).
[24] C SONG, X YAN, Q LIU et al. Magnetic and ferroelectric properties of indium-doped gallium ferrite. Journal of Magnetism and Magnetic Materials, 469, 8-12(2019).
[25] H SONG S, H LO C C, J LEE S et al. Magnetic and magnetoelastic properties of Ga-substituted cobalt ferrite. Journal of Applied Physics, 101(2007).
[26] X WANG Q. Effect of Co, Zn and Al Doping on the Structural and Properties for Multiferroic GaFeO3. Beijing: China University of Mining and Technology, Master’s Dissertation(2014).
[27] Z LIU C. The Study of the Modification and Multiferroic Properties of GaFeO3 Nano-material. Shanghai: East China Normal University, Master’s Dissertation(2012).
[28] C ABRAHAMS S, M REDDY J. Magnetic, electric, and crystallographic properties of gallium iron oxide. Physical Review Letters, 13, 688(1964).


Set citation alerts for the article
Please enter your email address

© Copyright 2018-2021 | Chinese Laser Press. All Rights Reserved 沪ICP备15018463号-20