
Li Pei, Yang Shanshan, Ding Zhihua, Li Peng. Research Progress in Fourier Domain Optical Coherence Tomography[J]. Chinese Journal of Lasers, 2018, 45(2): 207011
- Chinese Journal of Lasers
- Vol. 45, Issue 2, 207011 (2018)
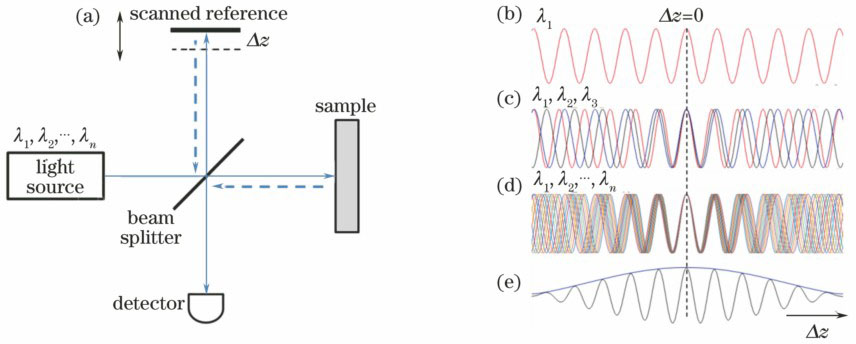
Fig. 1. Michelson interferometer and optical low coherence interference. (a) Michelson interferometer; (b) cosine function simple harmonic oscillation of interference signal; (c)(d) interferometric fringe; (e) short coherence length light
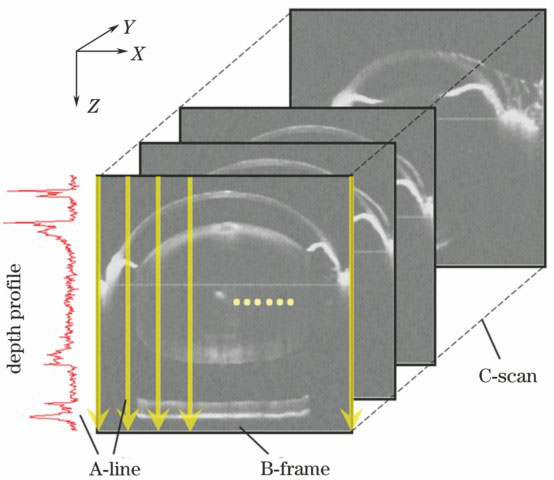
Fig. 2. Reconstruction of 3D OCT image for mouse full eye in vivo
Fig. 3. Schematic of Fourier domain low coherence interference. (a) spectral domain detection; (b) swept source detection; (c) signal reconstruction from frequency domain to spatial domain
Fig. 4. Lateral resolution of OCT with different numerical apertures
Fig. 5. Sensitivity falling-off versus depth
Fig. 6. 3D imaging of the whole anterior segment of the human eye. (a) 3D rendering of the full anterior segment (covering range of 12 mm×18 mm×18 mm); (b) typical cross-sectional image; (c) sub-regions of the corneo-scleral limbus, cornea, anterior and posterior parts of the crystalline lens
Fig. 7. OCT images of chick embryonic heart. (a) Longitudinal section; (b) cross section; (c) M-mode structural image along the vertical dashed line in (b) which the boundary of myocardial wall is indicated by the solid curves; (d) M-mode structural image superimposed with radial strain rate of the myocardial wall and Doppler velocity of blood flow (The vertical scale bar is 200 μm, and the horizontal bar is 0.1 s)
Fig. 8. 3D label-free OCTA imaging of the rat cortex vasculature[15]

Set citation alerts for the article
Please enter your email address
© Copyright 2018-2021 | Chinese Laser Press. All Rights Reserved 沪ICP备15018463号-20